
[Go] pprof를 사용해 profiling을 해보자(부제: 당신은 서버 이상 원인을 어떻게 찾으시나요?)
![[Go] pprof를 사용해 profiling을 해보자(부제: 당신은 서버 이상 원인을 어떻게 찾으시나요?)](https://images.unsplash.com/photo-1516382799247-87df95d790b7?crop=entropy&cs=tinysrgb&fit=max&fm=jpg&ixid=MnwxMTc3M3wwfDF8c2VhcmNofDF8fGxvdXBlfGVufDB8fHx8MTY3MjQxMDc4Mw&ixlib=rb-4.0.3&q=80&w=2000)
[요약]
- pprof는 go 어플리케이션을 profiling 해주는 도구이다.
- go는 go tool에서 pprof를 기본적으로 지원해주기 때문에 쉽게 pprof를 이용할 수 있다.
- graphviz를 통해 분석을 시각화해서 볼 수 있다.
- cpu, 메모리, trace 등을 원하는 타겟, 기간에 설정해서 볼 수 있어 이상 원인 파악에 용이하다.
pprof란?
 google
Profiling은 메모리 사용량, 함수별 CPU 점유 시간, tracing 등 어플리케이션을 동적으로 분석하는 것을 말합니다. 서비스를 운영하는데 메모리 누수가 점점 쌓이거나 혹은 특정 로직 실행이 너무 오래걸릴 때 등 문제의 원인 파악을 용이하게 해줍니다.
pprof는 Go 어플리케이션 데이터를 profiling해 분석하는 도구입니다. Callstack과 symbolization 정보가 담겨있는 프로토콜 버퍼를 분석합니다. 그래서 profiling을 하려면 어플리케이션에 profile.proto를 생성하는 로직을 넣는 선행 작업이 필요합니다. 정리하면 다음과 같은 과정을 통해 profiling을 합니다.
1) 어플리케이션에 profile.proto 생성 로직 작성
2) 어플리케이션 실행 후 체크하고 싶은 지점에서 profile.proto를 생성
3) pprof로 profile.proto 분석
Go로 만든 어플리케이션은 pprof를 이용해 편리하게 profiling을 할 수 있습니다. protocol buffer와 pprof, Go 모두 구글에서 만들었다보니 pprof를 사용하기 편합니다. 분석할 수 있는 항목들은 다음과 같습니다.
- allocs: 메모리 할당을 샘플링합니다.
- block: 동기화 메커니즘(synchronization primitives)에서 발생한 blocking을 trace합니다
- cmdline: 프로그램에서 발생한 command line 호출을 알 수 있습니다
- goroutine: 모든 현재 고루틴들을 stack trace합니다
- heap: 메모리에 할당된 살아있는 오브젝트들을 샘플링합니다
- mutex: 충돌된 뮤텍스 홀더들의 stack trace를 할 수 있습니다
- profile: CPU를 profile할 수 있습니다
- threadcreate: 새로 만들어진 OS thread에 대한 stack trace를 합니다
- trace: 현재 프로그램 실행에 대한 trace입니다.
이제 Go 어플리케이션 분석을 위해 pprof를 사용하는 방법을 소개합니다.
Prerequiste
profiling을 할 때 분석 데이터를 시각 자료로 보면 빠르고 잘 이해할 수 있습니다. pprof로 시각화 자료를 만들려면 graphviz가 필요합니다. 다음 커맨드를 통해 graphviz를 설치해봅시다.
$ sudo yum install graphviz앞서 pprof를 사용하려면 프로토콜 버퍼를 생성하는 로직을 작성해야 한다고 말씀드렸습니다. 말은 거창하지만 작성되는 코드는 몇 줄 되지 않습니다. 어플리케이션의 main.go에서 net/http/pprof를 링크하고 접속할 수 있는 포트를 하나 뚫어놓으면 준비완료입니다.
package main

import (
    "http"
    _ "net/http/pprof"
    ...
)

func main() {
    ...

    go func() {
     http.ListenAndServe("0.0.0.0:6060", nil)
    }()

    ...
}
net/http/pprof를 링크했을 때 내부에서 어떤 로직이 동작하는지 살펴보겠습니다.
func init() {
  http.HandleFunc("/debug/pprof/", Index)
  http.HandleFunc("/debug/pprof/cmdline", Cmdline)
  http.HandleFunc("/debug/pprof/profile", Profile)
  http.HandleFunc("/debug/pprof/symbol", Symbol)
  http.HandleFunc("/debug/pprof/trace", Trace)
}

// Index responds with the pprof-formatted profile named by the request.
// For example, "/debug/pprof/heap" serves the "heap" profile.
// Index responds to a request for "/debug/pprof/" with an HTML page
// listing the available profiles.
func Index(w http.ResponseWriter, r *http.Request) {
  if strings.HasPrefix(r.URL.Path, "/debug/pprof/") {
    name := strings.TrimPrefix(r.URL.Path, "/debug/pprof/")
    if name != "" {
      handler(name).ServeHTTP(w, r)
        return
      }
    }

    type profile struct {
      Name  string
      Href  string
      Desc  string
      Count int
    }

    var profiles []profile
    for _, p := range pprof.Profiles() {
      profiles = append(profiles, profile{
        Name:  p.Name(),
        Href:  p.Name() + "?debug=1",
        Desc:  profileDescriptions[p.Name()],
        Count: p.Count(),
      })
    }

    // Adding other profiles exposed from within this package
    for _, p := range []string{"cmdline", "profile", "trace"} {
      profiles = append(profiles, profile{
        Name: p,
        Href: p,
        Desc: profileDescriptions[p],
      })
    }

    sort.Slice(profiles, func(i, j int) bool {
      return profiles[i].Name < profiles[j].Name
    })

    if err := indexTmpl.Execute(w, profiles); err != nil {
      log.Print(err)
    }
}init 함수를 보면 수집한 pprof를 템플릿에 담아 /debug/pprof 로 노출시키는 것을 확인할 수 있습니다. Index 함수에서 사용하는 pprof.Profile은 runtime 패키지를 이용해 cpu 데이터, heap 사용량, 고루틴 개수 등을 수집합니다.
아까 6060 포트로 서버를 뚫었기 때문에, localhost:6060/debug/pprof로 접속하면 pprof가 수집한 데이터들을 볼 수 있다는 것을 예상할 수 있습니다.
Profiling 해보기
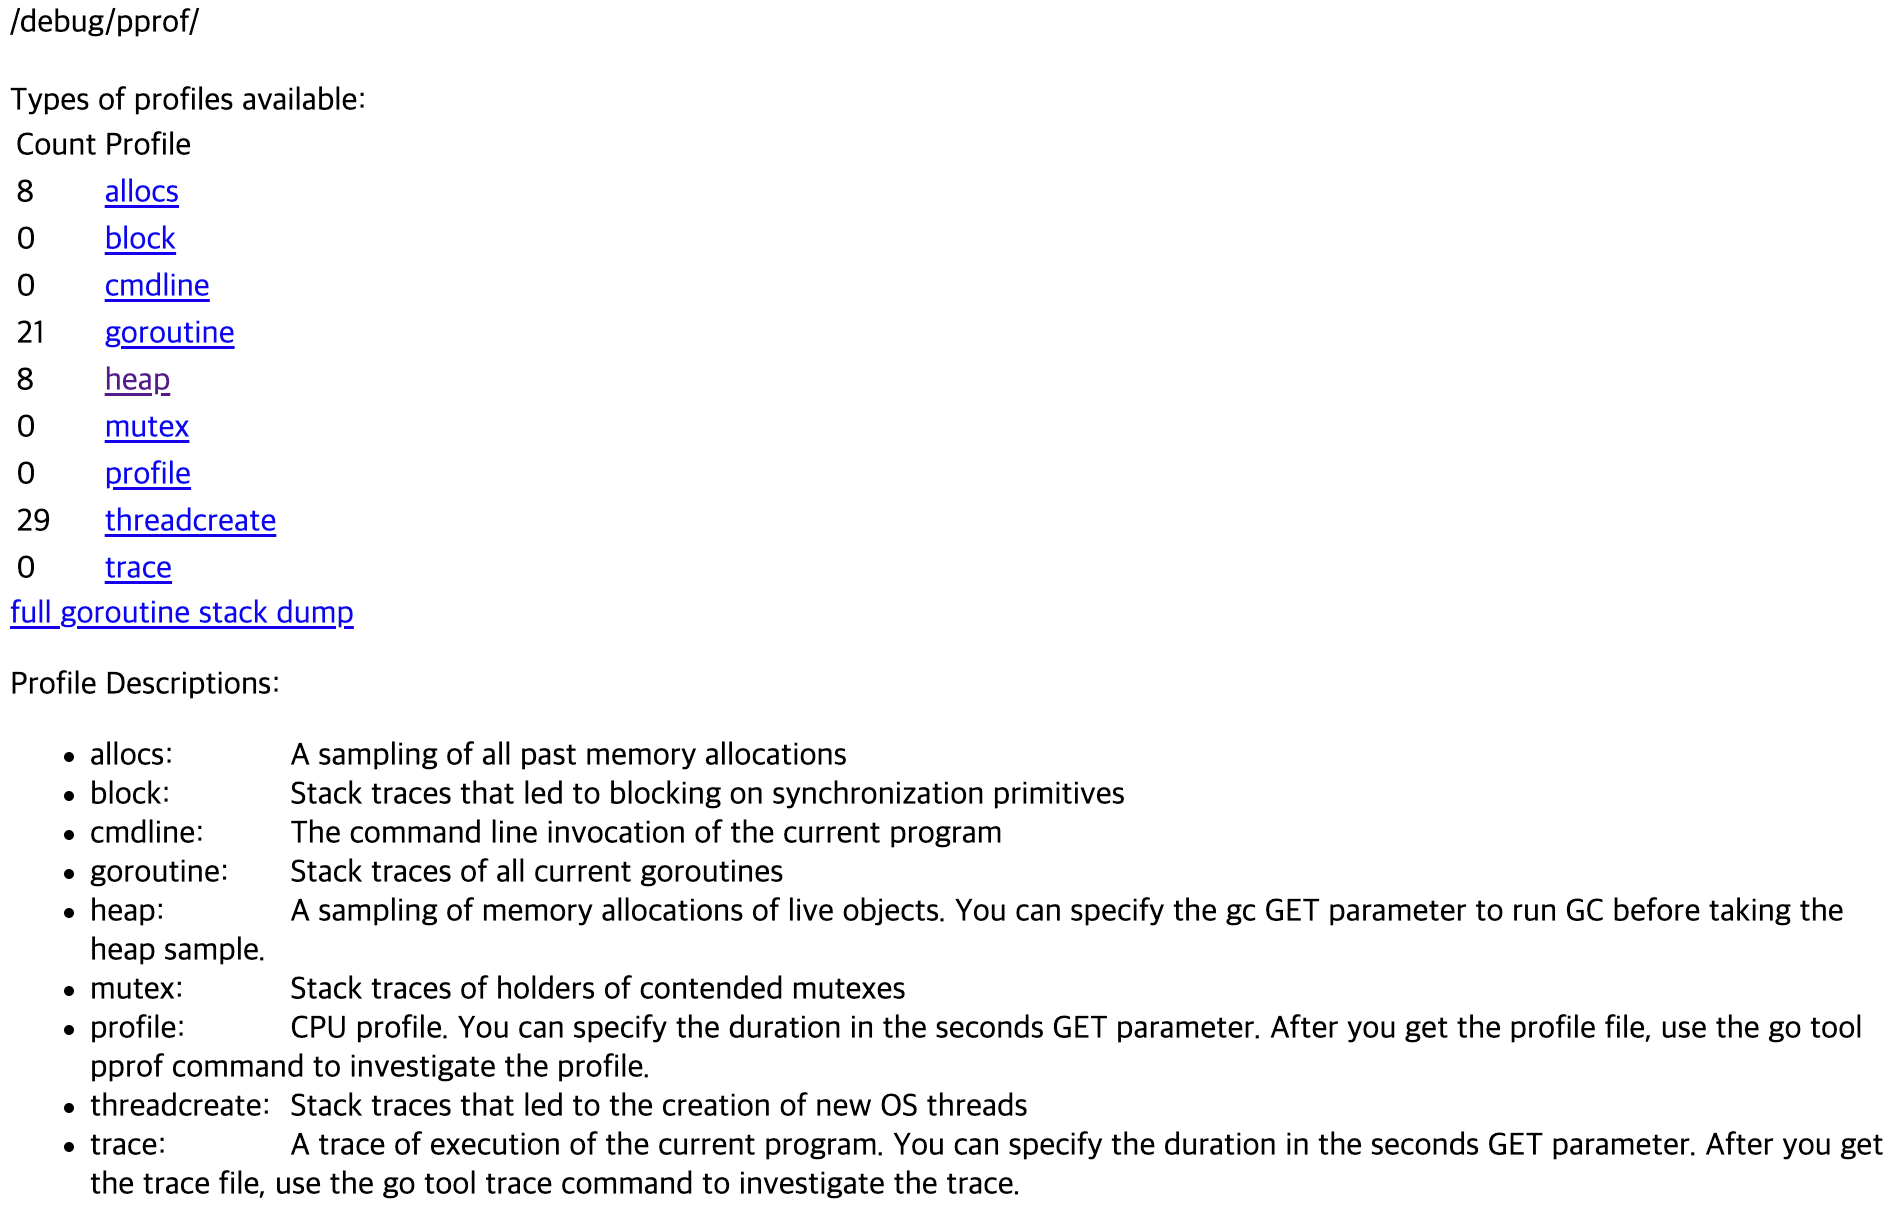
잘 따라오셨다면 서버 가동 이후 localhost:6060/debug/pprof로 위와 같은 페이지를 볼 수 있습니다. 하이퍼링크를 눌러보면 수집한 데이터를 확인할 수 있습니다. /debug/pprof/heap?seconds=30 과 같이 몇 초 동안 profiling 할지도 정할 수 있습니다.
curl http://0.0.0.0:6060/debug/pprof/heap\?seconds\=30 --output heap.prof이렇게 분석할 수도 있지만 좀 더 편하게 보기 위하여 go에서 지원하는 go tool을 사용할 수 있습니다. go tool을 shell에 치시면 다음과 같은 도구들 목록이 나옵니다.
$ go tool
addr2line
...
pprof
test2json
trace
vet
pprof를 go에서 지원해주는 것을 확인할 수 있습니다! go만 설치했다면 go tool pprof를 shell에 치는 것만으로 profiling을 할 수 있습니다.
go tool pprof를 이용해 서버에서 profile 파일을 받아와 interactive하게 분석해보겠습니다.
$ go tool pprof http://0.0.0.0:6060/debug/pprof/goroutine
Fetching profile over HTTP from http://0.0.0.0:6060/debug/pprof/goroutine
Saved profile in /home1/user/pprof/pprof.application.goroutine.001.pb.gz
...
(pprof) top 10$ go tool pprof http://0.0.0.0:6060/debug/pprof/heap
Fetching profile over HTTP from http://0.0.0.0:6060/debug/pprof/heap
Saved profile in /home1/irteam/pprof/pprof.application.alloc_objects.alloc_space.inuse_objects.inuse_space.001.pb.gz
...
(pprof)interactive 모드로 들어가면 커맨드를 사용해 분석을 할 수 있습니다. 이것보다 좀 더 쉬운 방법은 분석을 시각화해서 보는 것입니다. 아까 graphviz를 설치했으면 시각화해 볼 수 있습니다. go tool pprof를 이용해 시각화해서 보는 방법은 아래와 같습니다.
$ go tool pprof -http [address:port] [Profile File]
$ go tool pprof -http [address:port] [Profile HTTP Endpoint]이제 위 명령을 활용한 예시를 보여드리겠습니다.
$ go tool pprof -http 0.0.0.0:8080 http://0.0.0.0:6060/debug/pprof/heap이제 생성된 profile 시각화 자료를 0.0.0.0:8080으로 볼 수 있습니다. 아래는 해당 포트에서 볼 수 있는 예시입니다.
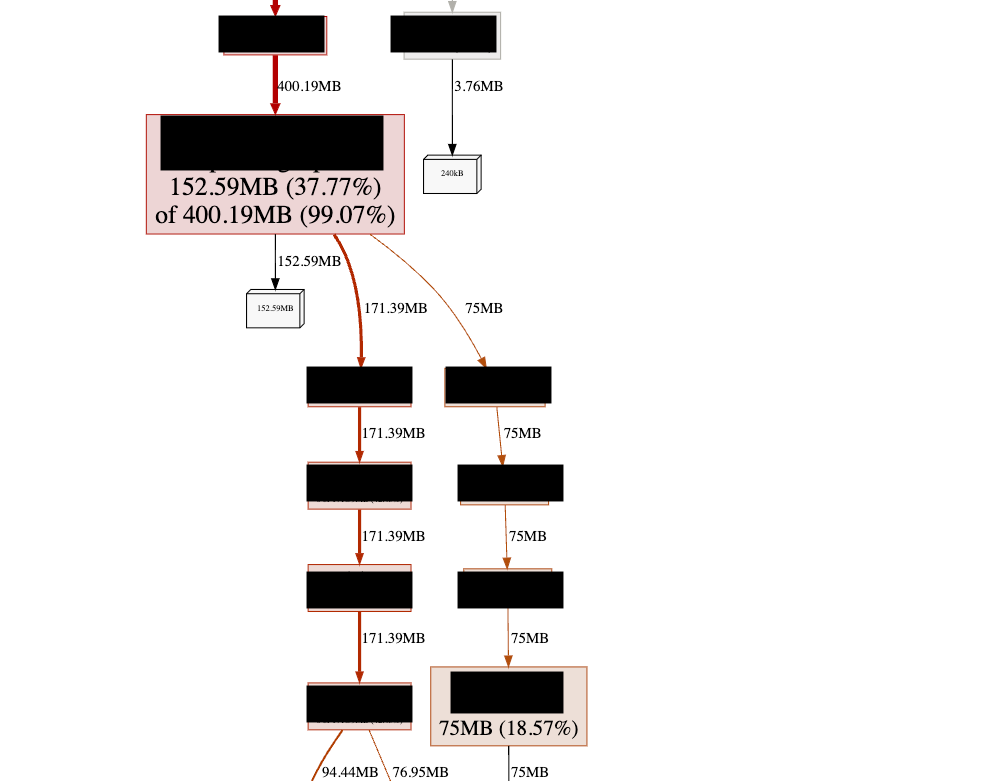
위 예시는 heap을 통해 함수별 메모리를 본 것이지만 함수별 걸린 시간을 측정할 수도 있습니다.
$ curl http://0.0.0.0:6060/debug/pprof/profile\?seconds\=180 --output profile.outgo tool pprof -http 0.0.0.0:9090 profile.outtrace 해보기
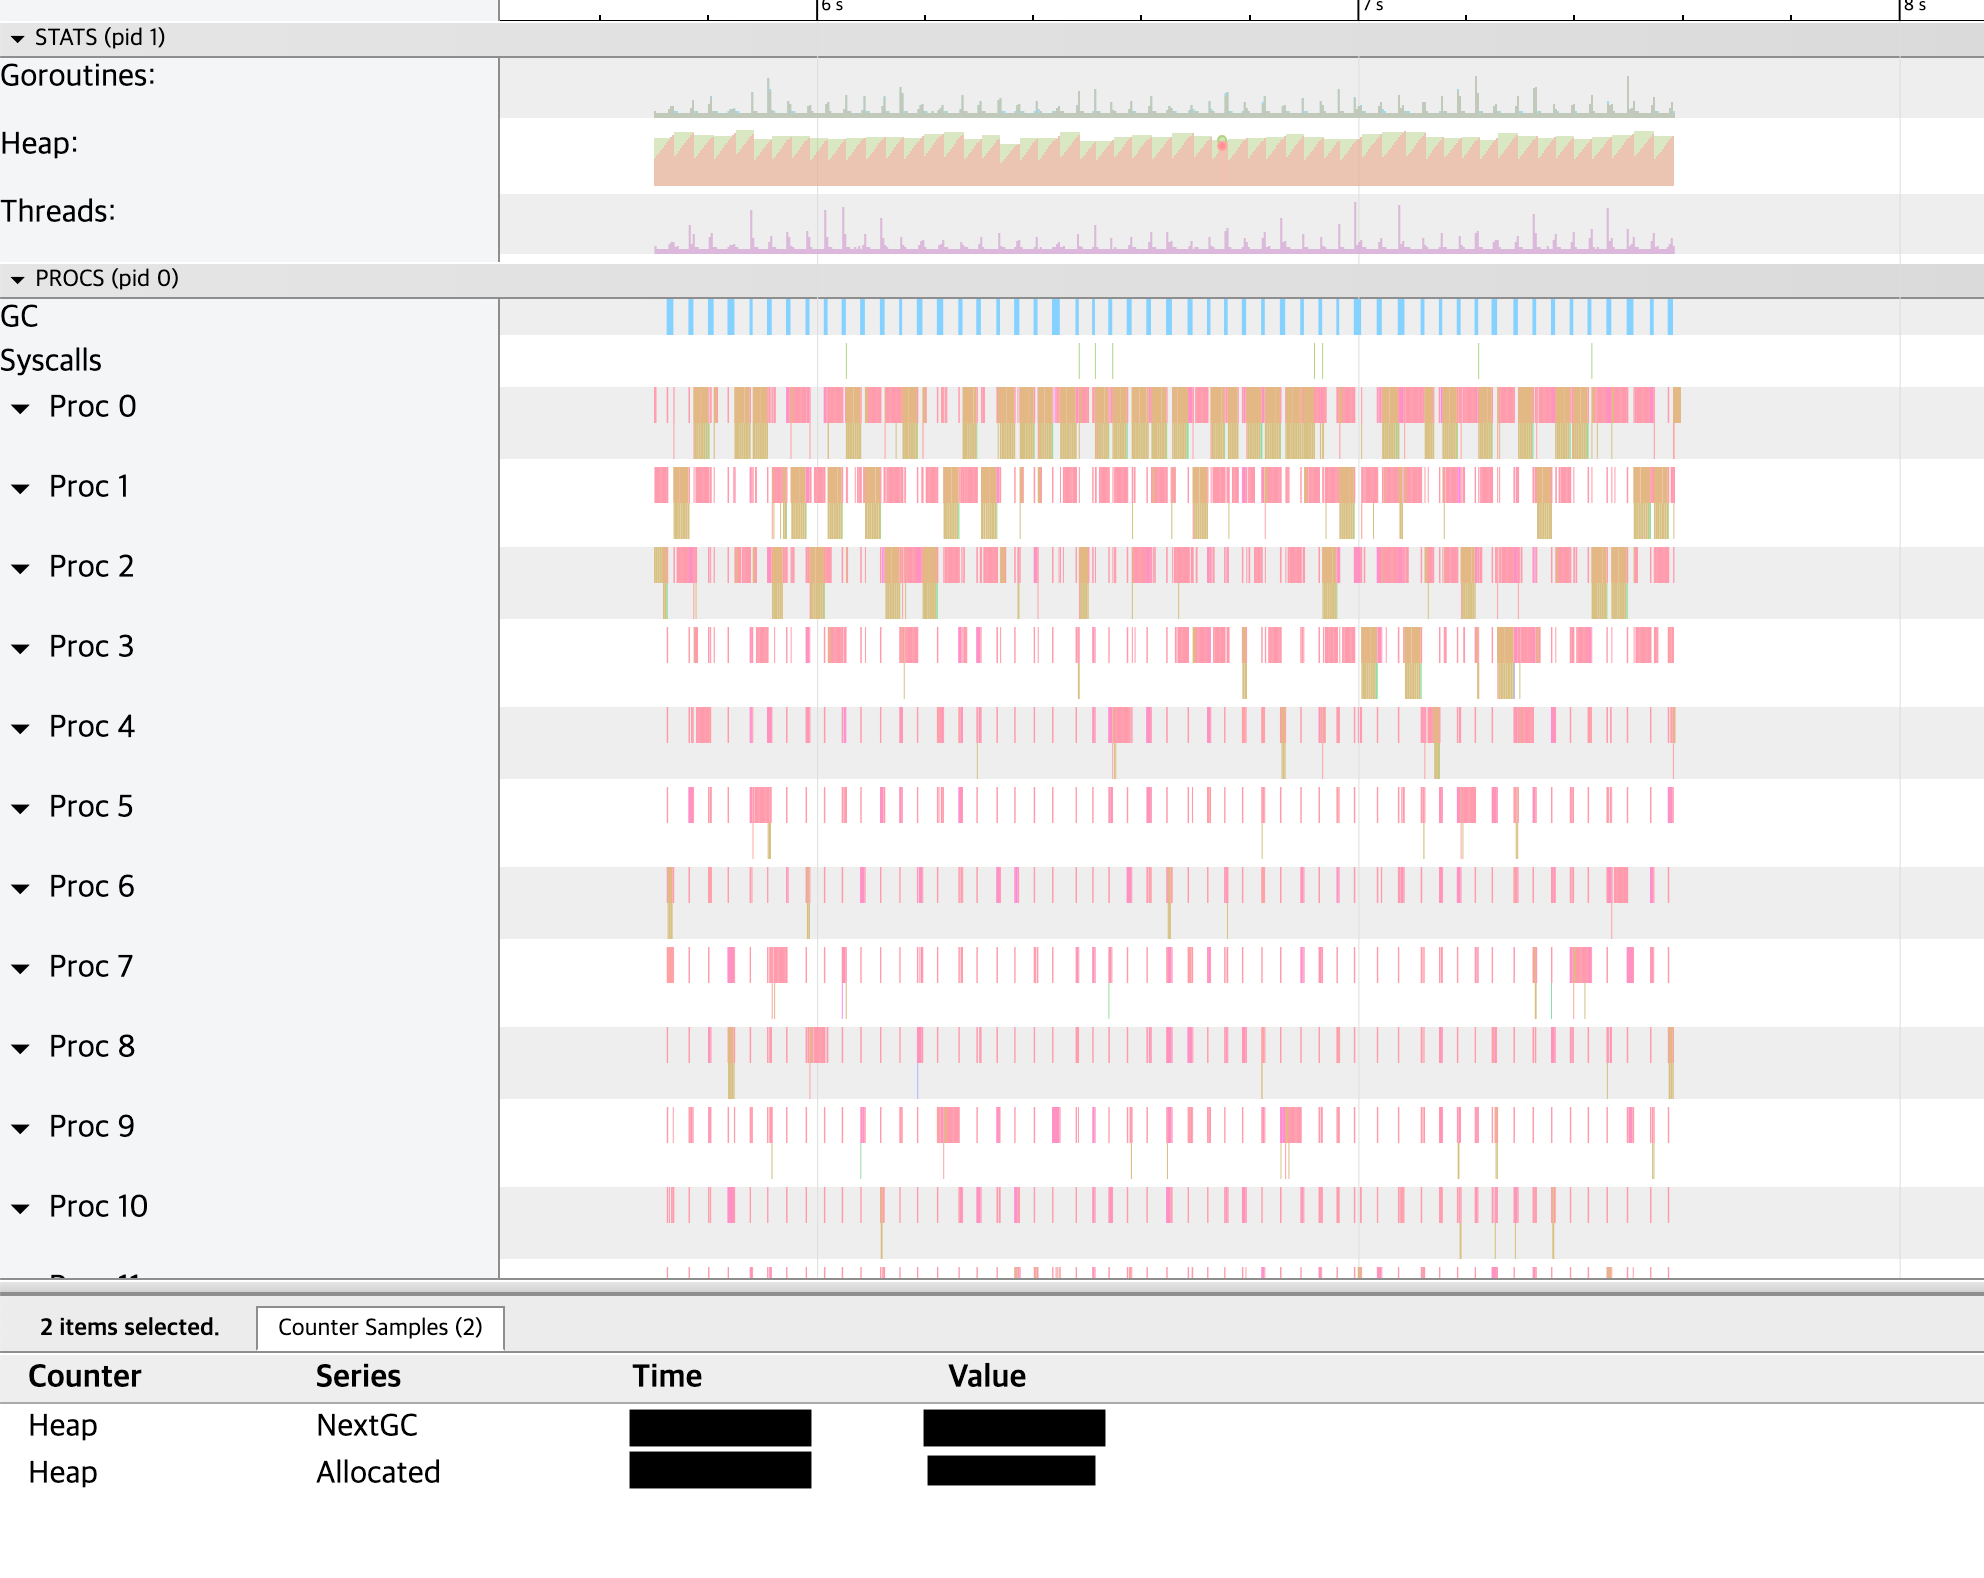
go tool에서 사용할 수 있는 profiling 도구로 trace도 있습니다. trace는 고루틴, Heap의 사용이나 각 프로세스가 어떤 일을 했는지 time series로 볼 수 있게 도와줍니다. trace도 pprof와 마찬가지로 profile 프로토콜 버퍼를 받아와야 합니다.
curl http://0.0.0.0:6060/debug/pprof/trace\?seconds\=30 --output trace.out이제 생성한 trace 파일을 go tool trace를 통해 분석해봅시다.
go tool trace -http 0.0.0.0:9090 trace.outtrace 파일은 앞선 profile 파일보다 크기가 커서 로딩하는데 시간이 더 오래 걸립니다. 완료가 된 이후 9090 포트로 들어가면 다음과 같은 분석 화면을 볼 수 있습니다.
Reference
DataDog