
Applying Profiling - Your Go Application Can Do Better

This article is an English translation of the post that I published on the Naver Tech Blog (D2).
One effective way to significantly improve application performance is to identify bottlenecks and optimize those areas. Profiling allows for dynamic analysis of an application, making it easier to pinpoint bottlenecks. That's why many programming languages directly or indirectly support profiling tools.
Profiling has evolved beyond simply aiding in identifying the root causes of issues; it is now also used in compiler optimizations. Profile-Guided Optimization (PGO) is an optimization technique where the compiler references profile data during application builds. Many projects like LLVM and Chrome have already adopted PGO.
Naver's new search engine Noir, used in services like Naver Mail and Messaging, is written in Go. Go not only supports profiling but also, starting from version 1.21, Profile-Guided Optimization (PGO). However, finding well-organized resources on Go profiling has been challenging, causing some difficulties when applying it.
In this article, I'll share insights on Go application profiling and Profile-Guided Optimization (PGO) that I gathered while preparing to apply them to Noir.
Profiling in Go
Profiling refers to dynamically analyzing applications, including memory usage, CPU time per function, and traces. It facilitates identifying issues such as gradual memory leaks during service operation or specific logic that takes excessively long to execute.
pprof is a tool used to profile and analyze Go application data. It analyzes protocol buffer data containing call stack and symbolization information. Therefore, prior to profiling, you need to incorporate logic into your application to generate protocol buffer data. To summarize, the process of profiling involves the following steps:
- Write Protocol Buffer Generation Logic in Your Application
- Generate Protocol Buffer Data During Application Execution
- Analyze Protocol Buffer Data with pprof
When using Go, you can conveniently use pprof without the need to write these generation logics yourself. The items that can be analyzed include the following:
These are the features provided by pprof for analyzing Go applications:
- allocs: Samples memory allocations.
- block: Traces blocking events from synchronization primitives.
- cmdline: Shows command-line invocation of the program.
- goroutine: Provides stack traces of all current goroutines.
- heap: Samples live objects allocated in memory.
- mutex: Traces stack holders of contended mutexes.
- profile: Profiles CPU usage.
- threadcreate: Traces stack traces of newly created OS threads.
- trace: Traces the execution of the current program.
Now, let's introduce how to use pprof for analyzing Go applications.
Preparation Steps - Installing Graphviz and Writing Protocol Buffer Generation Logic
Visualizing analysis data during profiling can greatly enhance understanding. To generate visualization data with pprof, you need Graphviz. Let's install Graphviz with the following command.
$ sudo yum install graphvizEarlier, it was mentioned that you need to write logic to generate protocol buffers in order to use pprof. Despite the grandiose-sounding statement, the actual code needed is quite minimal. Simply linking net/http/pprof in your application's main.go and opening a port that allows access is all that's required to be set up and ready.
package main

import (
    "http"
    _ "net/http/pprof"
    ...
)

func main() {
    ...

    go func() {
     http.ListenAndServe("0.0.0.0:6060", nil)
    }()

    ...
}
Let's examine what happens internally when net/http/pprof is linked.
//net/http/pprof/pprof.go

func init() {
  http.HandleFunc("/debug/pprof/", Index)
  http.HandleFunc("/debug/pprof/cmdline", Cmdline)
  http.HandleFunc("/debug/pprof/profile", Profile)
  http.HandleFunc("/debug/pprof/symbol", Symbol)
  http.HandleFunc("/debug/pprof/trace", Trace)
}
The init function packages collected pprof profiles into templates and exposes them at /debug/pprof. The Index function utilizes the runtime package to gather CPU data, heap usage, goroutine counts, and more.
Profiling
When you run the sample code, you can see the following page at localhost:6060/debug/pprof
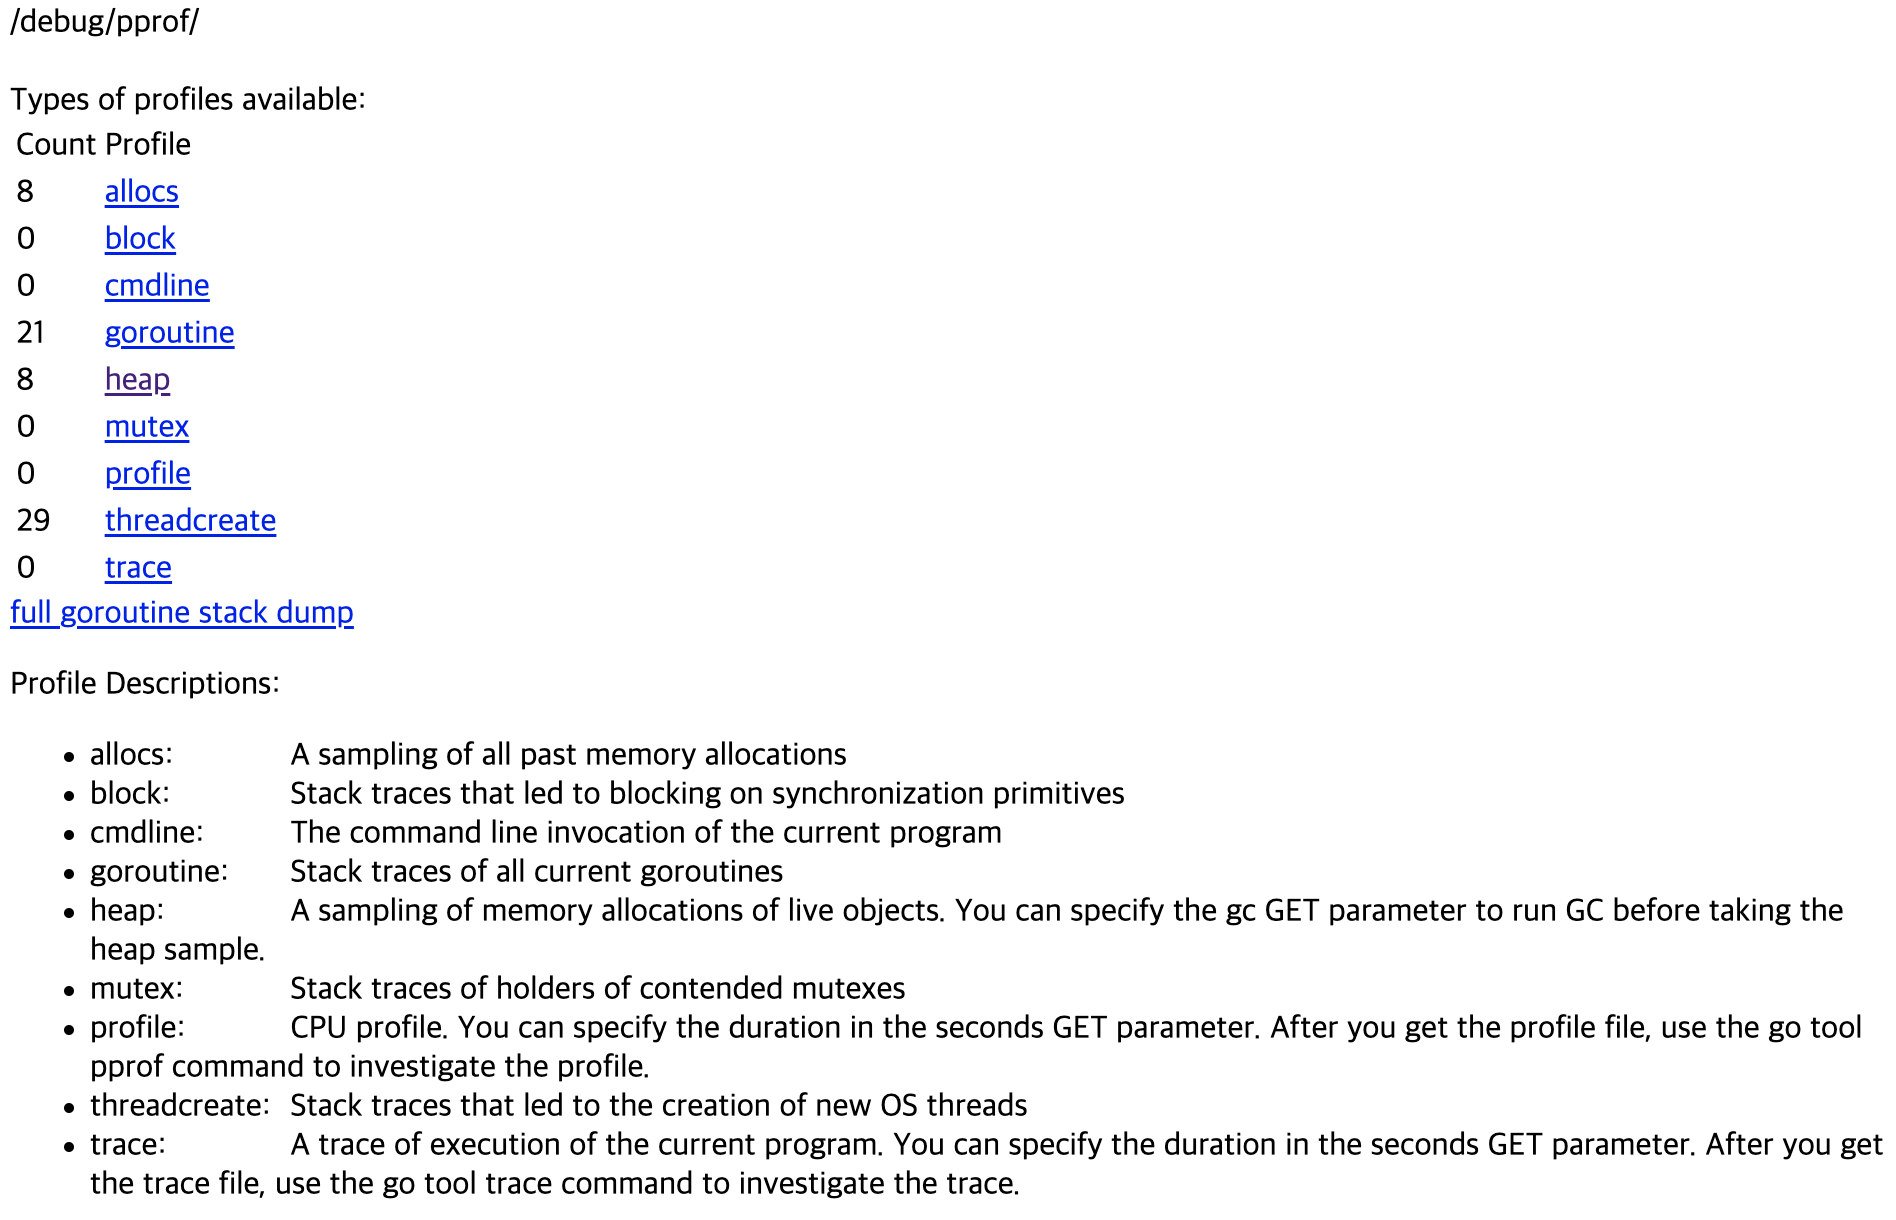
Clicking on the hyperlinks allows you to view collected data. Instead of viewing it in the browser, you can also use curl to download the profile data into a file.
curl http://0.0.0.0:6060/debug/pprof/heap\?seconds\=30 --output heap.profTo view profiles more conveniently, you can use the Go tools supported by Go itself. Typing go tool in the shell will display a list of available tools.
$ go tool
addr2line
...
pprof
test2json
trace
vet
You can confirm that Go supports pprof. If you have installed Go, simply entering go tool pprof in the shell allows you to perform profiling.
I will use go tool pprof to fetch and interactively analyze profile files from the server.
// Analyze goroutine
$ go tool pprof http://0.0.0.0:6060/debug/pprof/goroutine
Fetching profile over HTTP from http://0.0.0.0:6060/debug/pprof/goroutine
Saved profile in /home1/user/pprof/pprof.application.goroutine.001.pb.gz
...
(pprof) top 10

// Analyze heap alloc
$ go tool pprof http://0.0.0.0:6060/debug/pprof/heap
Fetching profile over HTTP from http://0.0.0.0:6060/debug/pprof/heap
Saved profile in /home1/irteam/pprof/pprof.application.alloc_objects.alloc_space.inuse_objects.inuse_space.001.pb.gz
...
(pprof)
An easier way than this is to visualize the analysis. If you have installed Graphviz, you can visualize the profile.
$ go tool pprof -http [address:port] [Profile File]
$ go tool pprof -http [address:port] [Profile HTTP Endpoint]
Now, let me show you an example using the above command.
$ go tool pprof -http 0.0.0.0:8080 http://0.0.0.0:6060/debug/pprof/heapNow you can see the profile visualization data generated at 0.0.0.0:8080. Here is an example of what you can see on that port.
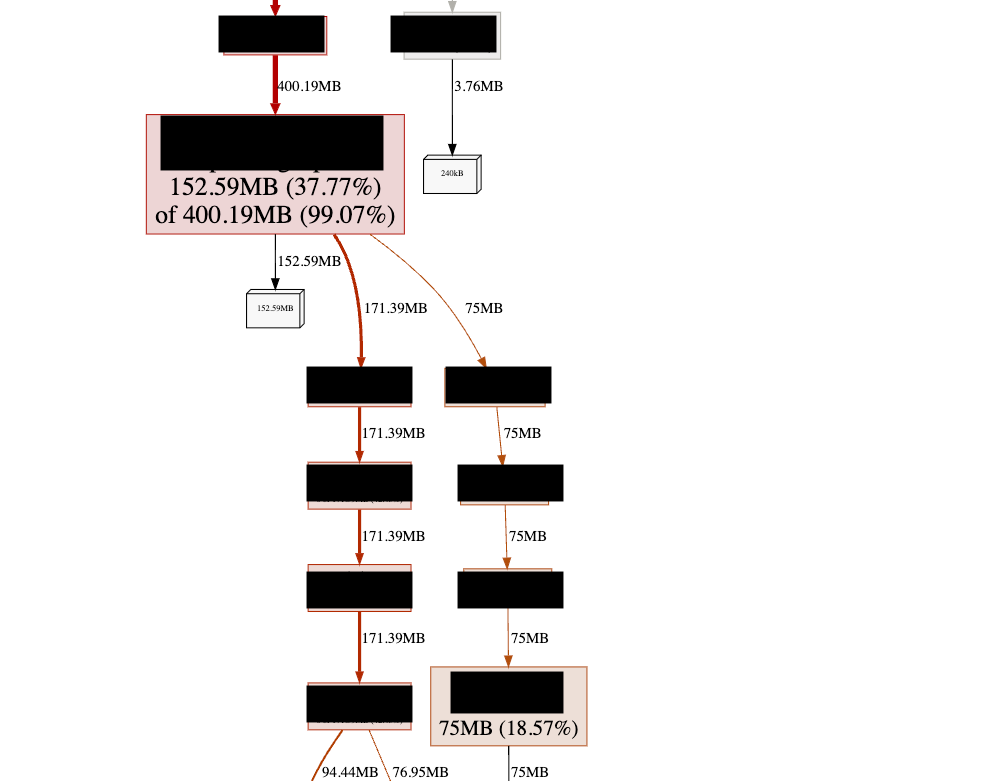
The example above shows viewing memory per function through heap profiling, but you can also view other types of data.
- Measure time taken per function
// Downloaded profile data collected over 180 seconds
$ curl http://0.0.0.0:6060/debug/pprof/profile\?seconds\=180 --output profile.out

// Visualize collected profile data
go tool pprof -http 0.0.0.0:9090 profile.out - Trace
// Downloaded trace data collected over 30 seconds
$ curl http://0.0.0.0:6060/debug/pprof/trace\?seconds\=30 --output trace.out

// Visualize collected trace data
 go tool trace -http 0.0.0.0:9090 trace.out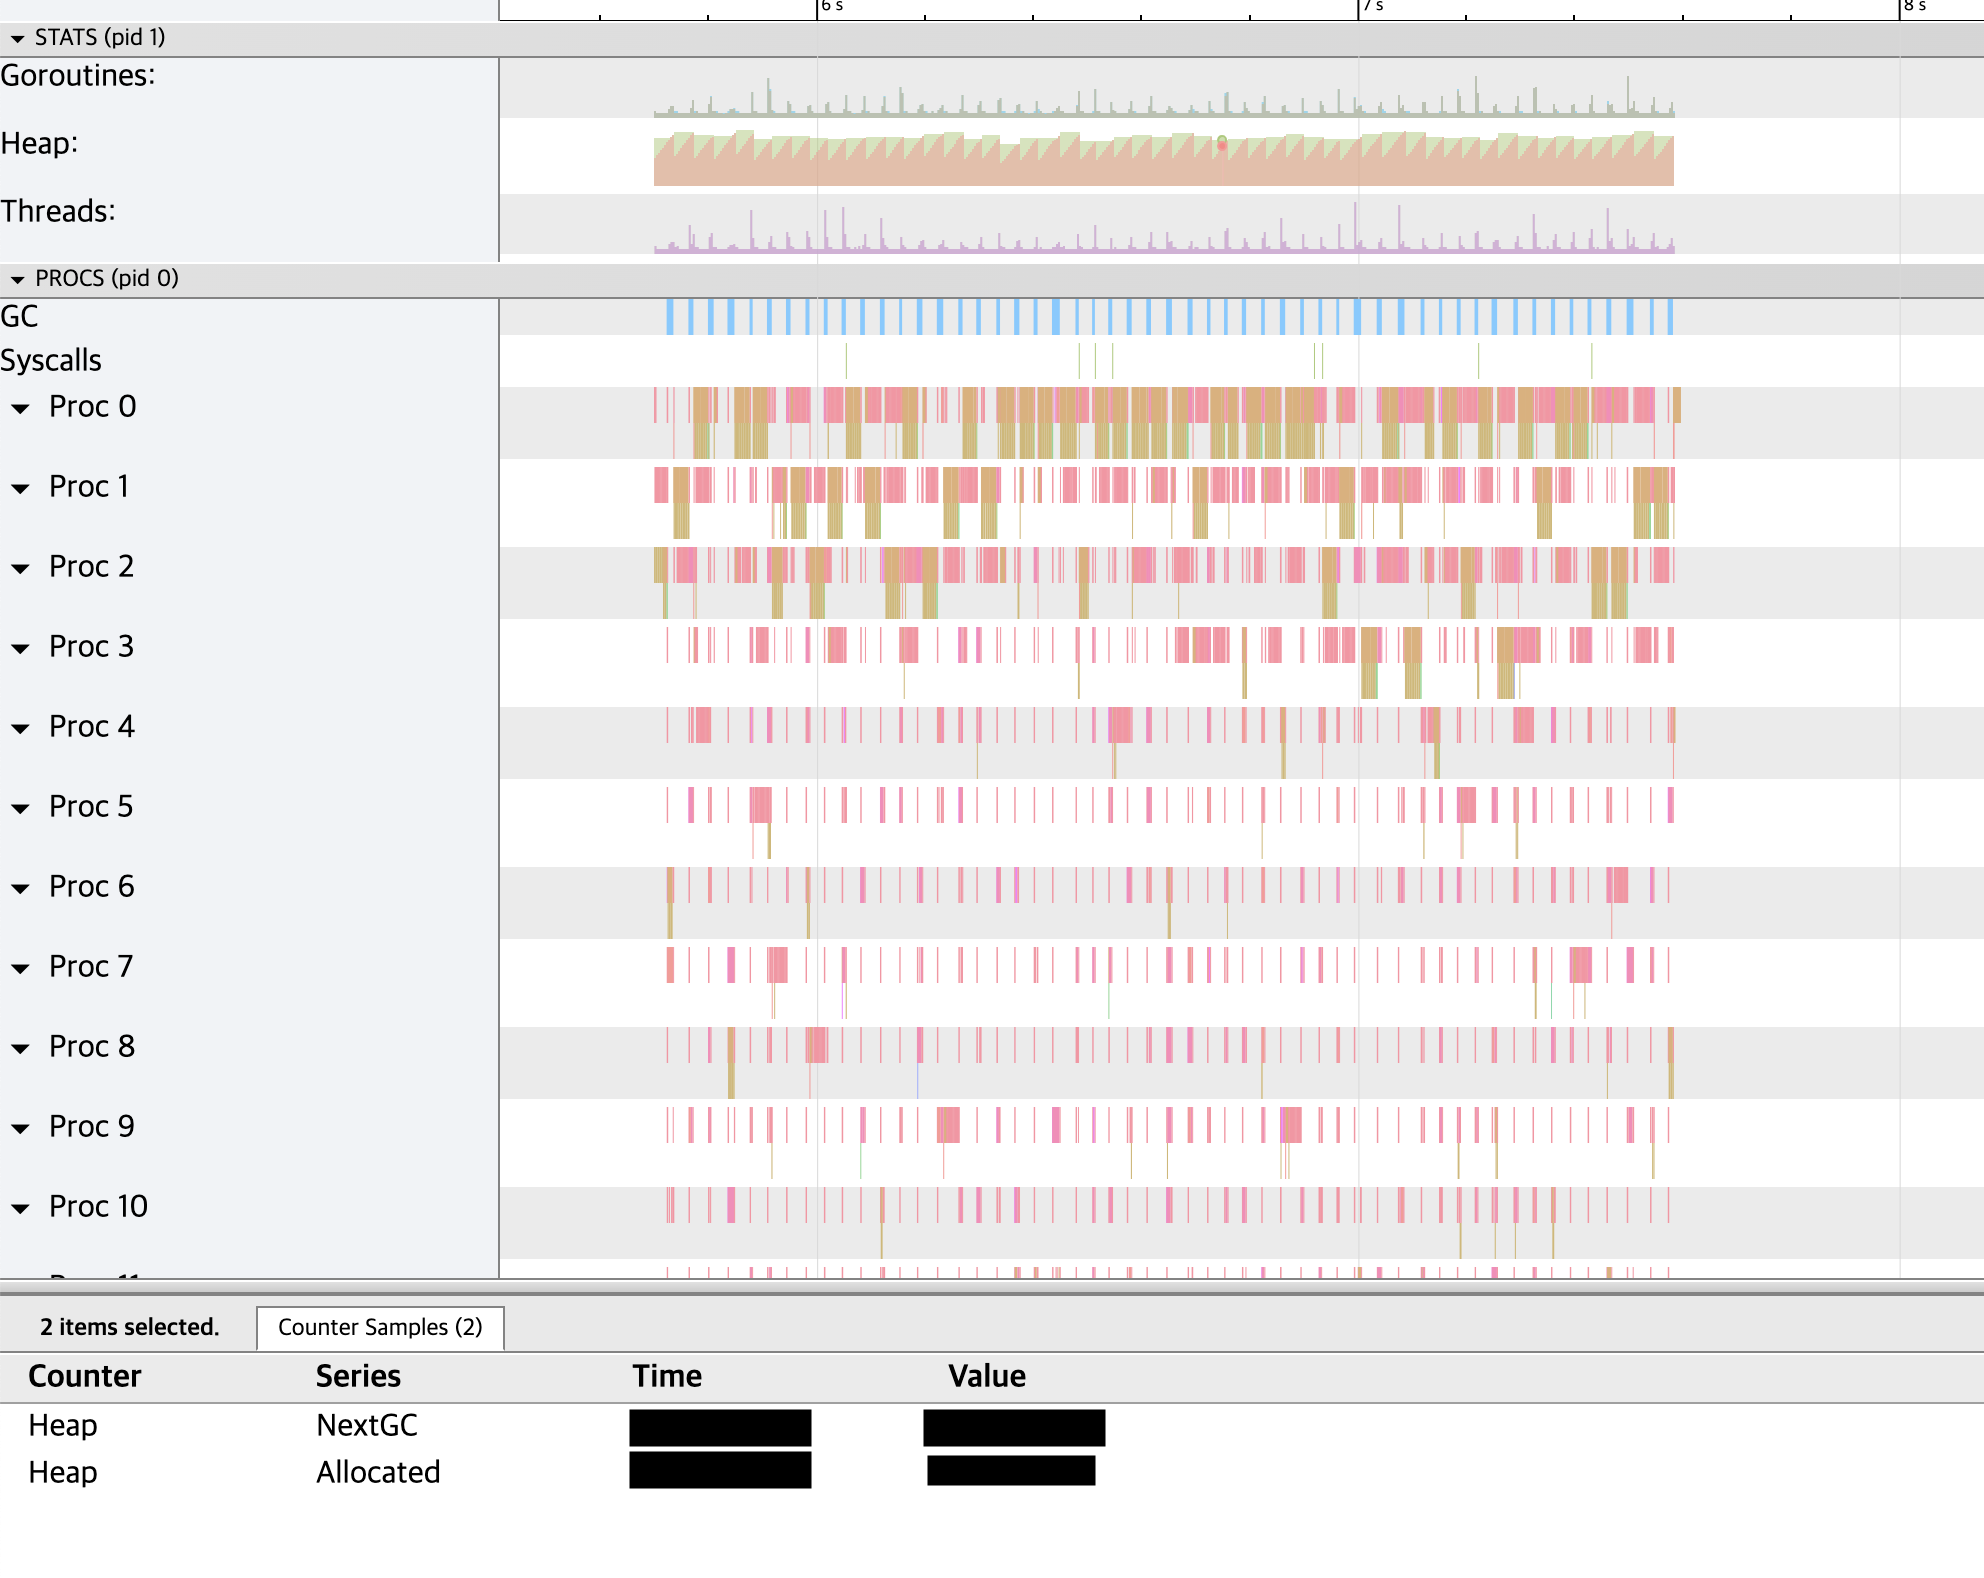
Case Study (in Noir)
In early 2023, after Noir was newly applied to a service, there was a sudden spike in CPU usage and search latency increased by over 100 times compared to normal.
Based on experiments conducted before deploying the service, it was known that the part where searches were conducted without distinguishing between uppercase and lowercase letters or katakana/hiragana had the highest overhead. Initially, this was suspected to be the cause.
However, profiling revealed that the actual root cause of the problem was completely different.
The major contributors to CPU usage were inefficient memory copying and preprocessing unnecessary parts during searches. Thanks to profiling, we were able to quickly identify bottlenecks without much trial and error. As a result, we reduced normal latency and CPU usage to less than a third, and latency during problematic scenarios decreased to less than 1/70th.
Why were the bottlenecks identified in the experiment before service deployment different from those identified during profiling? This is because the search data used in the service and the experiment were different. Even for the same application, changing the handled data can alter the bottlenecks. For example, reading small-sized files during search may have minimal impact, but if the file size increases by 1000 times, that segment could become a bottleneck. In real services, which are much more complex, unexpected factors can also become causes.
Therefore, it is recommended to perform profiling with data similar to that of the actual service environment. This will greatly assist in improving service performance.
PGO
PGO (Profile-Guided Optimization) is a compiler optimization technique that utilizes profile data gathered during program execution to improve build-time optimizations.
Many traditional compiler optimizations rely on static analysis of source code without using runtime data, often hard-coding frequency information for operations like inlining, register allocation, and instruction scheduling. One drawback of these techniques is that they do not consider specific code invocation frequencies during runtime.
PGO, on the other hand, optimizes based on profile data collected from real production or test environments. By incorporating actual code invocation frequencies, it reduces heuristic dependencies during compilation optimizations. However, if the profile data environment differs significantly from the application's execution environment, there may be a performance degradation.
Several companies and projects already utilize PGO:
- LLVM: After adopting PGO, LLVM reduced compilation times by 20%.
- Chrome: In Chrome 85 (2020), using PGO with the Clang compiler led to a 10% performance improvement.
- Firefox: Optimizing Clang with PGO decreased Firefox's compilation times by 9%.
PGO is supported not only in Go but also in various other languages and compilers:
- Rust's compiler supports PGO.
- .NET also supports PGO.
- Java can utilize PGO through Oracle's GraalVM.
Implementing PGO in Go
This explanation is based on the proposal "Design and Implementation of Profile-Guided Optimization (PGO) for Go."
Compilation process without using PGO
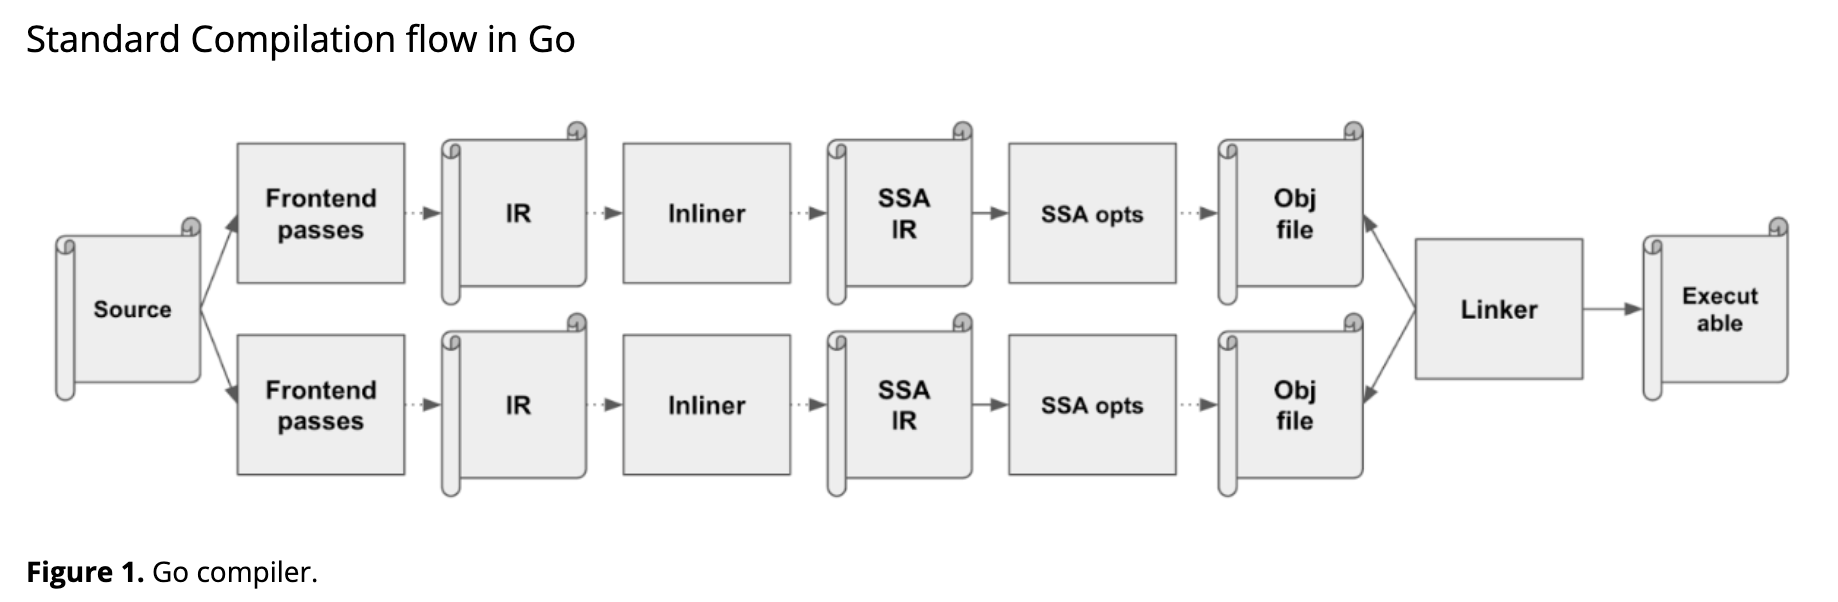
To understand how PGO optimizes, let's briefly look at the standard optimization processes in the existing Go compiler.
Inlining Optimization
Go's inlining optimization works bottom-up through the call graph. For each function, it checks if inlining is feasible by traversing the IR and calculating the cost of the function. If the cost exceeds a certain threshold, inlining is not performed. The decision also considers the size of the code in addition to just the cost.
Basic Block Layout Optimization
A basic block is an array of instructions with a single entry and a single exit point. The compiler operates on these basic blocks, ensuring that instructions within the same basic block are executed exactly once.
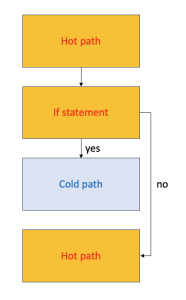
The layout of these basic blocks can be visualized as a graph. Let's look at an example.
// hot path
if (cold_cond) {
  // cold path
}
// hot path again
Here is the graph of the basic block layout for the code above:
However, it is advantageous to group hot paths together as shown in the following diagram:
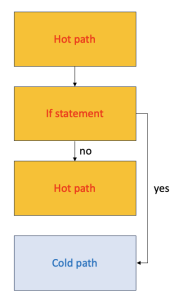
The reason for this optimal grouping relates to cache hits and branch costs:
- Placing hot paths consecutively improves instruction cache (i-cache) hits because the CPU prefetches instructions before they are executed.
- Branching disrupts this prefetching, making most of the prefetched bytes irrelevant, thereby reducing effective CPU fetch throughput. Therefore, optimizing the layout of basic blocks can significantly enhance application performance.
Go compiler performs basic block layout optimizations at the SSA level.
Other optimizations include
- Devirtualization at the IR level (changing interface methods to concrete type methods)
- Escape analysis
- Common Subexpression Elimination (CSE), dead-code elimination at the SSA-IR level
Compilation process with using PGO
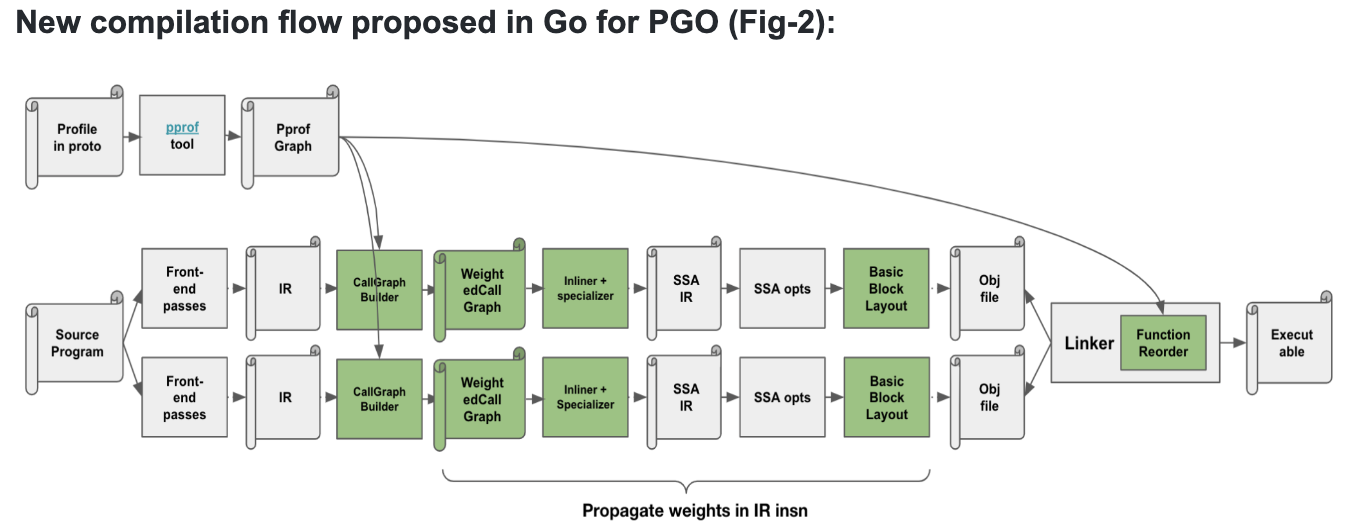
When using PGO, profile data is transformed into a graph. This graph contains edge and node weights that represent the entire IR call graph of functions. Alongside this, a table mapping IR to profile weights is created, which is used during basic block layout optimizations.
Inlining Optimization
In traditional compilation, decisions to inline functions are based on hardcoded thresholds. With PGO, these thresholds can be dynamically adjusted based on the frequency of function calls observed in the profile data. Often, only frequently called edges are considered for inlining to optimize code size.
For instance, in if-else statements where the condition (hot receiver) is frequently called, indirect function calls can be optimized into direct function calls by checking runtime types.
Basic Block Layout Optimization
At the SSA level, PGO utilizes profile data to optimize the layout of basic blocks.
Function Reordering
The linker prioritizes function placement in the text section based on call frequencies. This function reordering can span across packages since the linker has visibility into all packages constituting the binary.
In summary, PGO enables the compiler to perform better optimizations in inlining, basic block layout, and function reordering, leveraging profile data to make more informed decisions.
Will there be performance degradation during profiling?
While Go documentation recommends profiling in production, operational teams may worry about its impact on live services.
To profile in Go, typically a port is opened to allow external access for profiling data collection. The overhead primarily comes from the profiling process itself rather than the act of opening a port and running a server, which generally incurs minimal cost.
How does Go handle profiling? CPU profiling interrupts the program periodically, capturing stack traces of goroutines that received signals, while heap profiling involves the memory allocator recording allocation counts in stack traces. Although less invasive than instrumenting every function at compile time, there is still concern about potential overhead.
Fortunately, when using the pprof package in Go, profiling doesn't happen constantly even after initialization. It starts profiling right after receiving a request and runs for a specified duration provided as an argument. However, periodic locking and reading of profiling data during request processing can impact CPU usage and application performance.
These side effects can vary significantly depending on the application and its environment. For instance, in experiments mimicking Noir's service environment, a slight increase in search request latency of around 2% was observed during profiling.
Applying PGO in Go
Collecting profile data, as detailed earlier, will be omitted here. This article focuses on explaining how to apply Profile-Guided Optimization (PGO) using Go 1.21, which officially supports it.
The usage is straightforward. First, obtain the CPU profile data of your application using tools like pprof. There are two ways to apply this data to your build process
- Rename the profile data to default.pgo and place it in the main package directory.
- Specify the name of the profile data using the -pgo option when executing go build.
// 1st method
$ go build -o main

// 2nd method
$ go build -pgo=profile_path -o main
By choosing either method, you can easily obtain a binary optimized using PGO.
PGO Performance Improvement Effects
I'll share the performance improvement effects observed by applying PGO to Noir in a test environment.
Profile Data
To apply PGO, we simulated scenarios in the test environment based on production logs, since obtaining actual production profile data directly was not feasible.
Experimental Condition
We compared the performance of binaries with and without PGO applied, using profile data obtained from simulations. Each simulation was run 10 times, and we measured the average search latency for each. Excluding the minimum and maximum latencies, we calculated the average of the remaining 8 latencies for comparison.
Performance Improvement
Applying PGO reduced the search latency of the application by 2% compared to before optimization. According to Go documentation, applying PGO typically results in a performance improvement of around 2-7%, so our observed improvement falls within this expected range. However, while notable, this improvement was somewhat modest for full deployment in our service.
Limitations
Noir is utilized across multiple services, each with different search patterns. Optimizing a binary with profile data from scenario A may not yield significant benefits in scenario B. To effectively apply PGO in production, it's advisable to collect profile data separately for each scenario and potentially release different binaries accordingly. In our experiments, we found scenarios where performance remained largely unchanged despite optimization efforts.
AutoFDO
AutoFDO is an improved workflow of FDO (Feedback-Directed Optimization) introduced by Google in 2016.
AutoFDO collects profiles from regular binaries in production environments. Since the profiles obtained are generated by actual workloads, AutoFDO can potentially deliver greater performance improvements compared to traditional FDO.
The workflow pattern of AutoFDO is as follows:
- Build binaries without PGO.
- Collect profile data from production environments.
- Use the profile data to compile and redeploy.
- Repeat steps 2 and 3.
There are two main issues that can arise with AutoFDO:
- Performance may degrade with repeated deployments. For instance, if a profile identifies a frequently accessed function, PGO can optimize that function for improved performance. Once an optimized binary is redeployed, subsequent builds may not further optimize that function, potentially leading to decreased performance in subsequent versions.
- Changes in code during development may render previous binary profiles ineffective. This can result in lower performance compared to previous releases when deploying new versions.
Fortunately, Go has mitigated many of these issues with AutoFDO. However, since Go's support for PGO is relatively new, it hasn't been extensively validated with many real-world cases yet.
Conclusion
Noir successfully reduced CPU usage by a third and significantly improved search latency through profiling in early 2023. Currently, we are evaluating whether to implement AutoFDO based on cost considerations and the performance gains from PGO.
Just as profiling proved beneficial for Noir, I hope this article has been helpful to many developers using Go.
If you need further assistance or have more questions, feel free to ask!