Don't trust Go GC too much - detecting memory leaks and managing GC cycles

This article is an English translation of the post that I published on the Naver Tech Blog (D2).
Noir is a data-specific search engine written in Go that works well for services that have separate data for each user, such as mail. Noir is used by NAVER Mail, a message search service, and others.
Over the years of developing and operating Noir, we often observed that Noir server memory usage slowly increased over time, and we made a big effort to address this.
Go is a language with a garbage collector (GC), which means that developers don't have to worry too much about memory management. However, because of allowing so little intervention in memory management, the increased memory usage in Noir was a tricky issue to solve.
The following graph shows the memory usage of some Noir servers deployed in production.
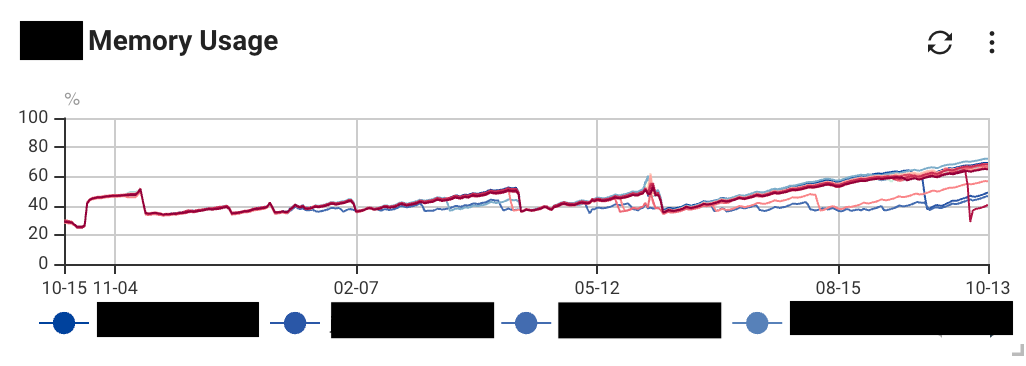
Over time, Noir server's memory usage increases. The drop in usage occurs when operators restart the search server for reasons such as deployment, which deallocates memory.
We did a lot of experimenting to figure out what was causing this, and we found that there are two main causes.
- If you're using cgo, you'll have memory managed by the C language rather than Go, which can cause memory leaks
- If your application is memory intensive, memory may be being allocated faster than it is being deallocated by GC
In this post, I'll share some of the methods we used to address Noir's high memory usage.
RES and Heap
Before we dive into the workaround, let's talk about RES and the heap in the process.

Resident Memory Size (RES) is the amount of physical memory that a process is actually using. The OS does not allocate physical memory until a process actually uses the memory it requests. Therefore, there is a difference between the amount of memory a process uses (virtual memory) and the amount of physical memory it actually uses (RES). RES is divided into shared libraries, which are used by multiple processes, and memory requested and used by a process (actual ram usage).
You can see RES with the top command.
The heap is the memory that is allocated in process by the OS to store data at runtime. Processes allocate memory from the OS when they have more data to store at runtime and deallocate it when they no longer need it. The implementation of heap varies from language to language, and Go uses a TCmalloc-inspired runtime memory allocation algorithm.
You can check the heap size of your Go application using runtime packages or by setting the GODEBUG=gctrace=1 environment variable.
In a nutshell, RES is related to OS-managed memory, heap is Go-managed memory, and RES is the size of all the memory the process needs to operate, not just the heap.
In other words, if the difference between the RES value and the heap size is large, it's probably due to memory used by places in the process that Go doesn't manage.
Kernel's memory behavior depending on Go version
When checking the RES value of a Go application, it is important to note that the RES value can vary depending on the version of Go.
Linux provides a system call called madvise. What value you set for madvise determines how the kernel manages the process's memory.
Go 1.12 through 1.15 uses MADV_FREE for madvise, while earlier or later versions use MADV_DONTNEED.
MADV_FREE has good performance but causes the kernel to delay deallocating memory unless there is memory pressure. MADV_DONTNEED, on the other hand, changes the semantics of the specified memory region to prompt the kernel to deallocate memory.
The following graph compares the memory usage of Dgraph, a GraphQL DB written in Go, when it loads data periodically, with MADV_DONTNEED applied (left) and MADV_FREE applied (right).

GODEBUG=madvdontneed environment variable - Dev - Discuss DgraphOn the left side, there are gaps where memory usage decreases because the kernel deallocates memory used since the data load. On the right, there are no gaps where the kernel does not deallocate memory, resulting in a decrease in memory usage.
If your version of Go is older than 1.12 and younger than 1.15, memory may be deallocated from the heap, but the kernel doesn't deallocate it and it ends up in RES.
Noir uses the latest version of Go, so this issue did not apply to us.
Detecting memory leaks in CGO code with VALGRIND
Noir had a large difference between the RES value and the heap size, so we speculated that the increased memory usage was likely coming from non-Go-managed memory.
Noir uses libraries written in C++. We usually use cgo to handle C code in Go. With cgo, the developer is responsible for allocating and deallocating memory like in C++, which can lead to memory leaks if memory is accidentally deallocated.
One useful tool for detecting memory leaks is valgrind.
However, if you feed a built Go program binary directly into valgrind, you will get a lot of warnings. This is because Go is a GC language, and valgrind cannot know exactly how Go runtime behaves. To minimize warnings, you can easily detect memory leaks by building test code that uses only CGO code separately and using it with valgrind.
After building the test code, we applied valgrind and saw the following results.
...
==15605== LEAK SUMMARY:
==15605==    definitely lost: 19 bytes in 2 blocks
==15605==    indirectly lost: 0 bytes in 0 blocks
==15605==      possibly lost: 3,552 bytes in 6 blocks
==15605==    still reachable: 0 bytes in 0 blocks
==15605==         suppressed: 0 bytes in 0 blocks
"Possibly lost" is memory managed by the Go runtime that valgrind has warned you about, and is not a memory leak (it's warning you that it's “possibly” lost because it's memory allocated to a running thread).
But "definitely lost" is that occurs when a pointer no longer exists in the program, but the memory allocation on the heap it points to has not been deallocated, which is a clear memory leak.
As it turns out, the logic for allocating and deallocating String objects was missing from the our CGO code.
After adding the deallocation function, we reran valgrind to resolve the definitely lost error.
...
==25027== LEAK SUMMARY:
==25027==    definitely lost: 0 bytes in 0 blocks
==25027==    indirectly lost: 0 bytes in 0 blocks
==25027==      possibly lost: 2,960 bytes in 5 blocks
==25027==    still reachable: 0 bytes in 0 blocks
==25027==         suppressed: 0 bytes in 0 blocks
How your application's memory usage changes over GC cycles
Setting appropriate GC cycle period can significantly reduce memory usage without changing application code, and can also solve problems with increased memory usage. For example, if memory usage is increasing because memory is being allocated to the heap faster than the GC is deallocating it, changing GC cycle period can be a solution.
This is not solved by simply making GCs shorter in duration; in fact, too many GCs can lead to higher overhead and faster memory usage.
GC in Go consists of two phases: Mark and Sweep. And the mark phase can be divided into one where STW (stop the world) occurs and one where it doesn't. So you can see three phases in the GC log.
When we think of Mark and Sweep, we usually think of Mark first and then Sweep. But if you look at Go's GC guide documentation or gctrace documentation, you can see that it works in the following order: Sweep (STW occurs) → Mark and Scan → End Mark (STW occurs).
Let's take a look at an actual GC log (as of Go 1.21).
gc 45093285 @891013.129s 8%: 0.54+13+0.53 ms clock, 21+0.053/17/0+21 ms cpu, 336->448->235 MB, 392 MB goal, 0 MB stacks, 0 MB globals, 40 P
- gc 45093285: This is the 45093285th GC log.
- 891013.129s: It has been 891013.129 seconds since the program started.
- 8%: The percentage of time spent by GC since the program started.
- 0.54+13+0.53 ms clock: In wall-clock time, it took 0.54 ms to Sweep (STW), 13 ms to Mark and Scan, and 0.53 ms to End Mark (STW).
- 21+0.053/17/0+21 ms cpu: Sweep (STW) took 21 ms, Mark and Scan (allocation 0.053 ms, background 17 ms, idle 0 ms) took 21 ms, and Mark End (STW) took 21 ms in CPU time.
- 336 → 448 → 235 MB: The heap size at the start of the GC, the heap size at the end of the GC, and the live heap size, respectively.
- 392 MB: The target heap size at the start of this GC.
GC sets a target heap size before it starts and tries to reduce the heap size to that size or less. The log above shows that the heap size after GC ends is 448 MB, which is larger than the target heap size of 392 MB, so the goal was not met. Because the application can allocate memory during Mark, it can also fail to meet the goal like the log above.
After the GC ends, the next target heap size is determined based on the live heap size (235 MB in the log above), and the next GC occurs when the heap size is expected to exceed the next target heap size.
As GCs occur more frequently, the percentage of time spent by GCs (the third column in the log) increases. The more resources the GC uses, the less resources the logic in your application has to work with, so you need to balance the GC frequency appropriately.
Parameters to adjust the GC interval
In Go, there are two parameters that allow you to adjust GC: GOGC and GOMEMLIMIT.
GOGC
GOGC is a parameter that allows you to adjust the target heap size.
The target heap size is set according to the following expression
target heap size = live heap + (live heap + GC roots) * GOGC / 100
The GOGC default is set to 100. If the GC roots are small enough compared to the live heap, you can think of the next target heap size as being twice the size of the live heap. For example, in the log we saw above, the next target heap size is set to be around 470 MB, which is double the 235 MB. In fact, if you look at the next GC log, you'll see that it's set to 471 MB, which is similar to 470 MB.
gc 45093286 @891013.160s 8%: 0.39+7.5+0.75 ms clock, 15+1.8/16/0+30 ms cpu, 406->467->196 MB, 471 MB goal, 0 MB stacks, 0 MB globals, 40 P
Increasing GOGC results in a larger target heap size and longer GC cycles. Lowering GOGC results in smaller target heap sizes and shorter GC cycles.
GOMEMLIMIT
Using GOGC alone to control the target heap size can cause problems.
For example, an application that uses a lot of memory in a moment might need to set GOGC low to avoid OOMs. But then during off-peak hours, the low GOGC might cause GCs to happen too often. In this case, you can set GOGC high by setting an upper bound on the target heap size.
The parameter that sets the upper limit of the target heap size is GOMEMLIMIT.
How GOGC and GOMEMLIMIT change application's memory usage
We measured Noir's memory usage changes by varying GOGC and GOMEMLIMIT in our test environment. We sent Noir a large number of search requests for about two weeks and checked the heap size changes with gctrace logs.
When nothing was set (GOGC=100), the heap size increased over time, while setting GOGC higher eliminated the heap size increase.
| GC CPU Usage | live heap average | Average heap value at GC startup | Change of live heap | Change of heap at GC startup | |
|---|---|---|---|---|---|
| GOGC=50 | 9% | 342.01MiB | 470.22MiB | -4.26MiB | -4.6MiB |
| GOGC=50, GOMEMLIMIT=800MiB | 17% | 640.48MiB | 697.12MiB | -19.23MiB | -12.35MiB |
| GOGC=100(default) | 8% | 149.95MiB | 260.16MiB | 32.01MiB | 55.79MiB |
| GOGC=200 | 6% | 102.95MiB | 273.76MiB | 0.95MiB | 2.96MiB |
| GOGC=200, GOMEMLIMIT=800MiB | 5% | 99.94MiB | 267.46MiB | -0.87MiB | -0.89MiB |
| GOGC=300 | 4% | 98.45MiB | 358.30MiB | -1.08MiB | -2.67MiB |
| GOGC=300, GOMEMLIMIT=800MiB | 4% | 95.71MiB | 350.82MiB | 0.63MiB | 4.44MiB |
| GOGC=400 | 3% | 97.60MiB | 451.43MiB | 1.79MiB | 6.5MiB |
| GOGC=400, GOMEMLIMIT=800MiB | 3% | 90.74MiB | 425.45MiB | -3.2MiB | -10.29MiB |
| GOGC=600 | 2% | 93.91MiB | 623.61MiB | 1.75MiB | 9.48MiB |
| GOGC=600, GOMEMLIMIT=800MiB | 8% | 500.11MiB | 677.98MiB | -91.57MiB | -33.89MiB |
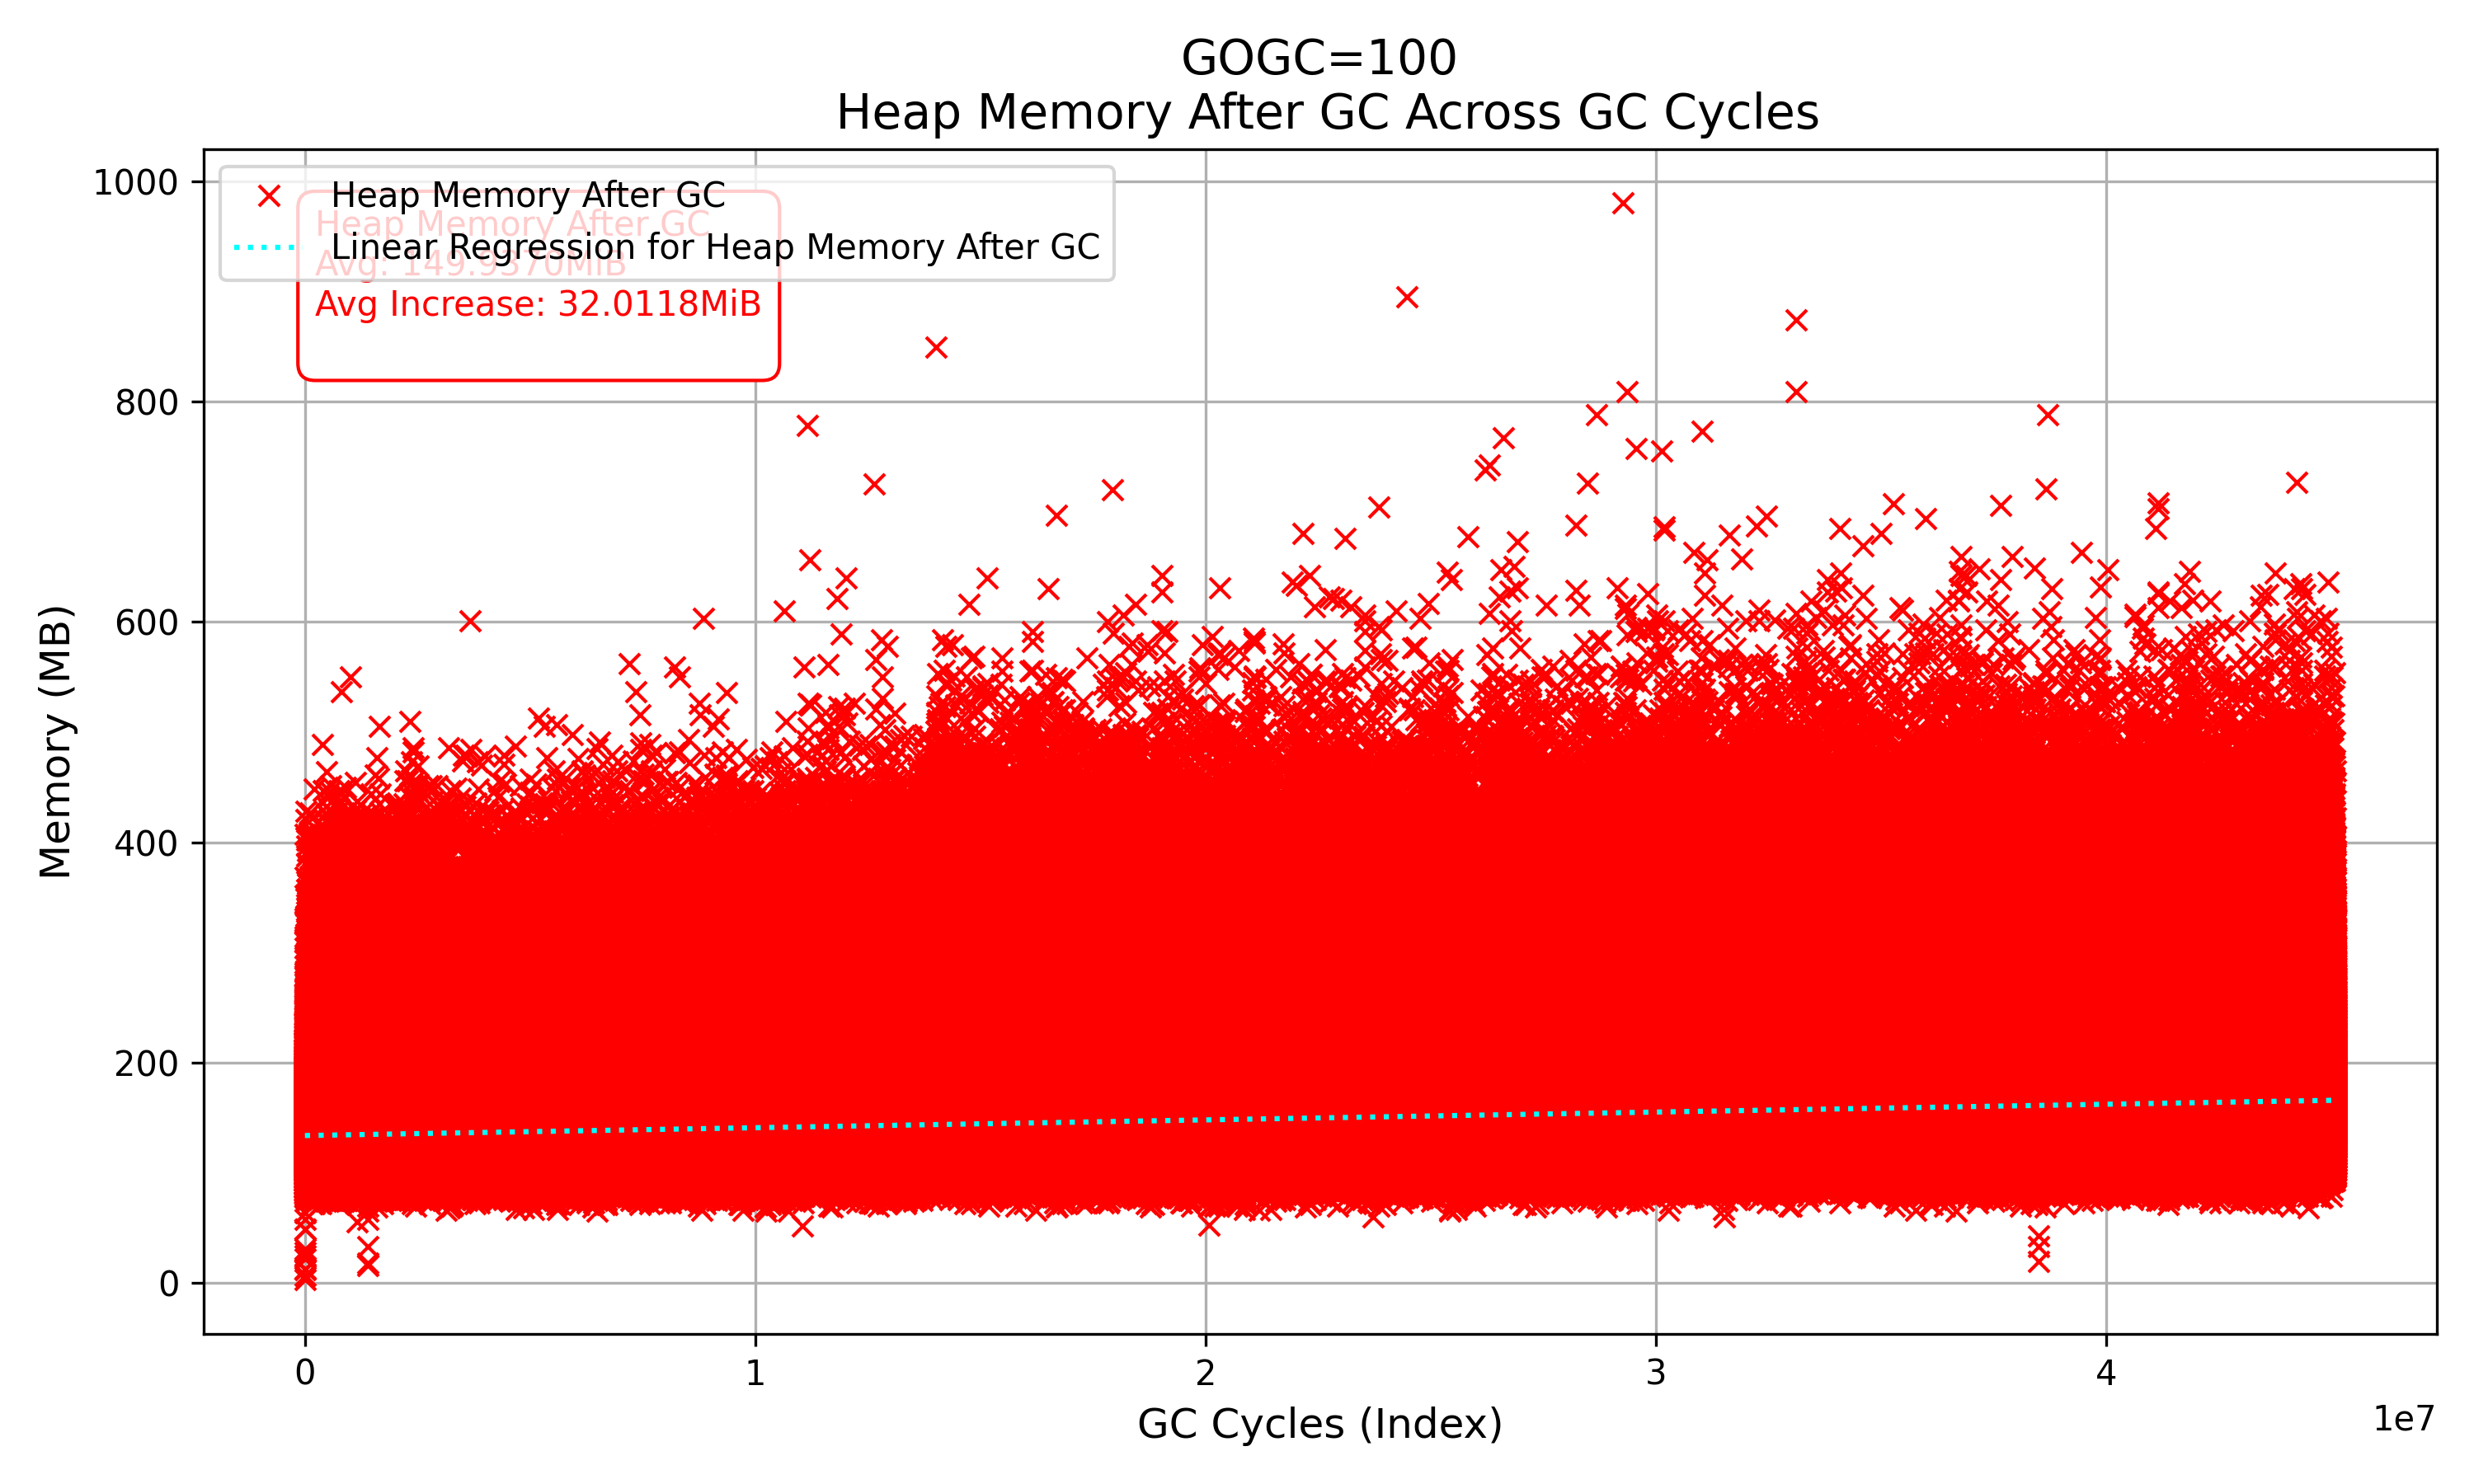
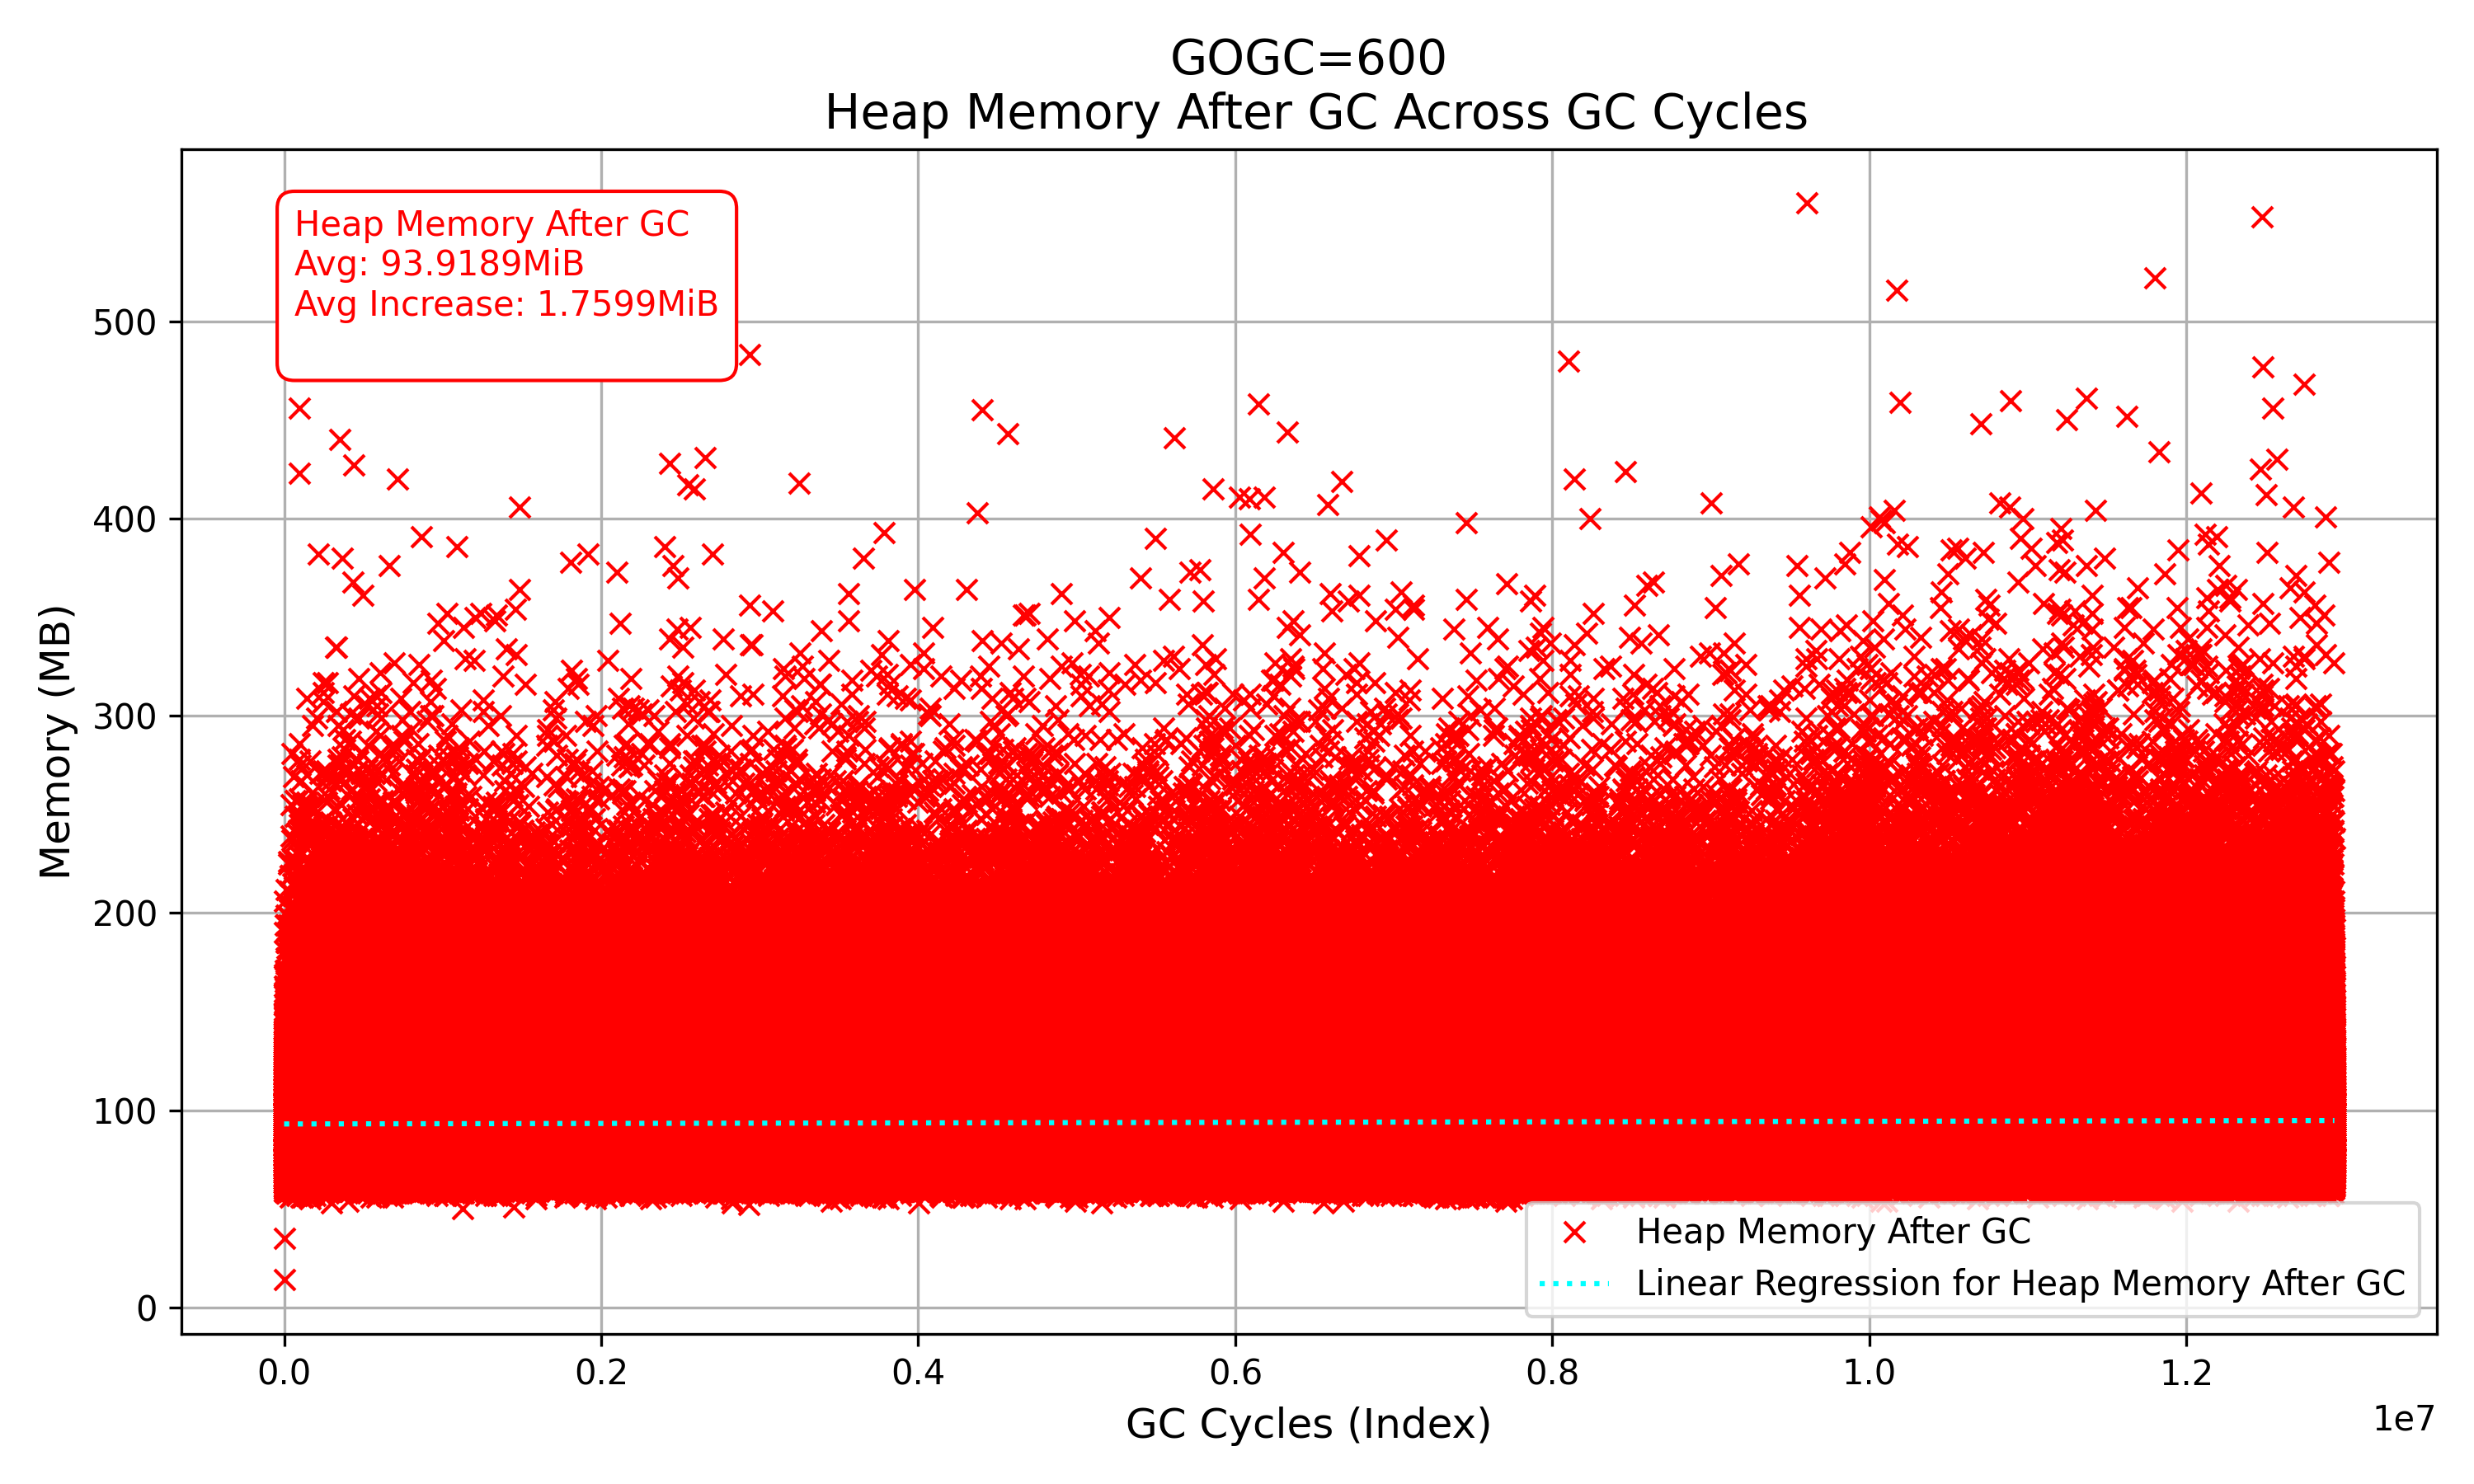
Comparing the graph of heap size when GOGC is 100 and 600, the increase in heap size is noticeable when GOGC is 100, while 600 shows little increase.
In addition to the increase in memory usage, there are other points worth noting in the table. Smaller GOGCs tend to cause GCs to happen more frequently, which increases the CPU utilization used by GCs, but increases the heap size. GOMEMLIMIT reduces the heap size for moderate values of GOGC (GOGC=200, 300, 400), but for extreme values of GOGC (GOGC=50, 600), the heap size increases along with CPU usage.
Therefore, be sure to experiment with GOGC and GOMEMLIMIT to find the right values before applying them.
Detecting excessive memory usage with the profiler
Applying heap profiling to your Go application can help you detect parts of your code that have unnecessary memory usage. (Profiling in Go applications is discussed in more detail in Applying profiling - Your Go application could be better.)
First, let's look at the operation of Go's memory allocator.

The mheap manages all the heap memory space in the Go program. The Resident set is divided into pages (usually 8 KB), and the mheap manages pages through mspan and mcentral.
The mspan is the most basic structure. As shown in the following figure, the mspan consists of a double linked list and stores the address of the entry page, the span size class, and the number of pages belonging to the span.
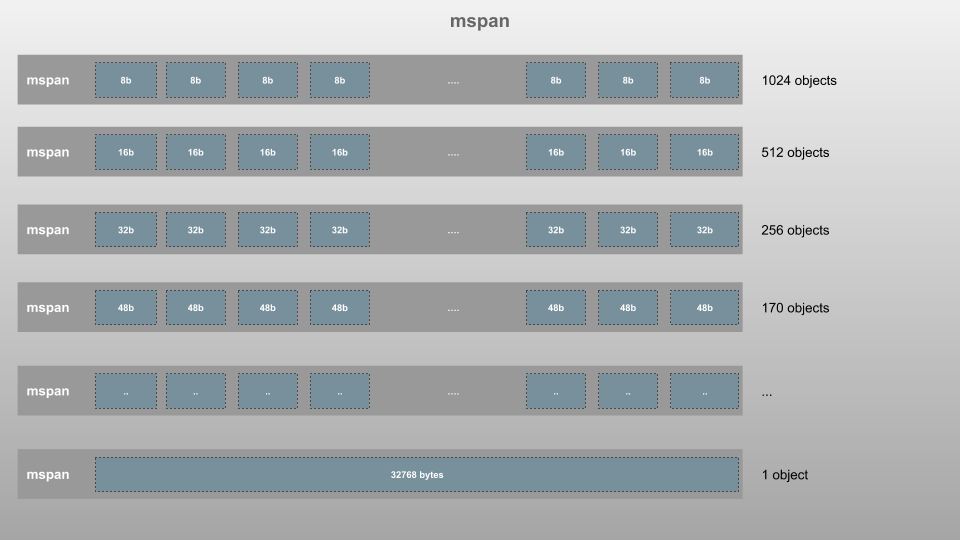
mcentral manages two mspan lists of the same size class. It manages the list of mspans you use and the list of mspans you don't, and when you use all the mspan lists you have, it asks mheap for an additional page.
The way objects are assigned depends on the size of the object.
- ~ 8byte: allocator in mcache assigned
- 8byte to 32KB: Part of mspan's size class (8byte to 32KB) and assigned to span
- 32 KB~: mheap directly allocates pages
At this time, objects assigned to span or objects assigned directly by mheap are likely to be internally fragmented.
For example, the following are some of Golang's size classes with objects between 8 bytes and 32 KB.
// class  bytes/obj  bytes/span  objects  tail waste  max waste  min align
...
//    56      12288       24576        2           0     11.45%       4096
//    57      13568       40960        3         256      9.99%        256
Suppose you assign a 13KB object. Because 13KB is larger than 12288 bytes and smaller than 13568 bytes, the object is assigned to the 57th size class. After allocation, the percentage of memory that the object uses is 13000/13568 = 95.8%. About 4.2% of internal fragmentation occurs.
There is also fragmentation that occurs between the size class and span. The 57th size class has three objects in 40960byte span. Even if three classes are filled in the span, the remaining memory 40960-3*13568 = 256byte occurs (tail waste). If only one 13KB object is created in the extreme case, it uses only one 13KB object of 40960byte span, resulting in approximately 68% internal fragmentation.
This time, consider allocating 35KB objects. Objects larger than 32KB directly assign pages, so do not use the size class.
// mcache.go
// allocLarge allocates a span for a large object.
func (c *mcache) allocLarge(size uintptr, noscan bool) *mspan {
    if size+_PageSize < size {
        throw("out of memory")
    }
    npages := size >> _PageShift
    if size&_PageMask != 0 {
        npages++
    }

    // Deduct credit for this span allocation and sweep if
    // necessary. mHeap_Alloc will also sweep npages, so this only
    // pays the debt down to npage pages.
    deductSweepCredit(npages*_PageSize, npages)

    spc := makeSpanClass(0, noscan)
    ...
}
The allocLarge function, which assigns more than 32KB of objects, calculates the number of pages (npage) that match the object size. After that, create a span for that object (makeSpanClass). If the OS has 8KB of page size, 35KB uses 5 pages and the total memory is 40KB. This is 35KB/40KB = 87.5%, resulting in 12.5% internal fragmentation.
We now know that for objects above 8 bytes, internal fragmentation can occur.
Go is densely populated with 67 size classes ranging from 8 bytes to 32 KB. So most of the cases don't have crucial internal fragmentation problems unless they are too large objects. However, if incorrect code logic overlaps, such as unnecessary copying of memory, the impact can grow.
There is an easy way to identify objects that may cause internal fragmentation in the application.
Heap profiling determines the number of objects used by each function (inuse_objects) and the memory size used by the objects (inuse_space), as shown in the following figure. This allows you to average object sizes by (the memory size used by objects)/(the number of objects).

As we saw earlier, if you have a large number of large objects, internal fragmentation is likely to affect memory usage. Therefore, it is recommended to reduce object allocation around functions that use large objects when optimizing the memory of an application.
Because objects are internally assigned to the span, you should avoid using only a fraction of them after sequentially assigning a large number of objects of the same size. Using pointers to separate assigned objects is also dangerous.
The following code is an example in which a pointer pointing to a 16-byte object is assigned as a slice and then only a pointer with a multiple of 512 is used.
// Allocate returns a slice of the specified size where each entry is a pointer to a
// distinct allocated zero value for the type.
func Allocate[T any](n int) []*T

// Copy returns a new slice from the input slice obtained by picking out every n-th
// value between the start and stop as specified by the step.
func Copy[T any](slice []T, start int, stop int, step int) []T

// PrintMemoryStats prints out memory statistics after first running garbage
// collection and returning as much memory to the operating system as possible.
func PrintMemoryStats()

// Use indicates the objects should not be optimized away.
func Use(objects ...any)

func Example3() {
    PrintMemoryStats() // (1) heapUsage: 0.41 MiB, maxFragmentation: 0.25 MiB

    slice := Allocate[[16]byte](1 << 20)
    Use(slice)

    PrintMemoryStats() // (2) heapUsage: 24.41 MiB, maxFragmentation: 0.24 MiB

    badSlice := Copy(slice, 0, len(slice), 512)
    slice = nil
    Use(slice, badSlice)

    PrintMemoryStats() // (3) heapUsage: 16.41 MiB, maxFragmentation: 16.19 MiB

    newSlice := Allocate[[32]byte](1 << 19)
    Use(slice, badSlice, newSlice)

    PrintMemoryStats() // (4) heapUsage: 36.39 MiB, maxFragmentation: 16.17 MiB

    Use(slice, badSlice, newSlice)
}
(reference: Memory Fragmentation in Go | Standard Output)
Although badSlice copied only few pointers, because of 16*512 = 8KB (page size), it leaves one used 16 byte object per page. As a result, none of the span can be deallocated because there are object which is used in all of spans.
Comparing (2) and (3), you can see that only 8MB of memory used by the pointer is deallocated and the memory used by the object is not deallocated, resulting in 16MB fragmentation.
In the case of Noir, we found that they were allocating a large amount of objects larger than 13KB in size through profiling. We confirmed that there was an unnecessary memory copy in that area, and we were able to reduce 30% of the total memory usage by modifying it.
End
As a result of the actions described in this article, Noir not only fixed the memory usage increase, but also reduced memory usage.
I hope this will also help others who are struggling with memory issues in the Go program.

